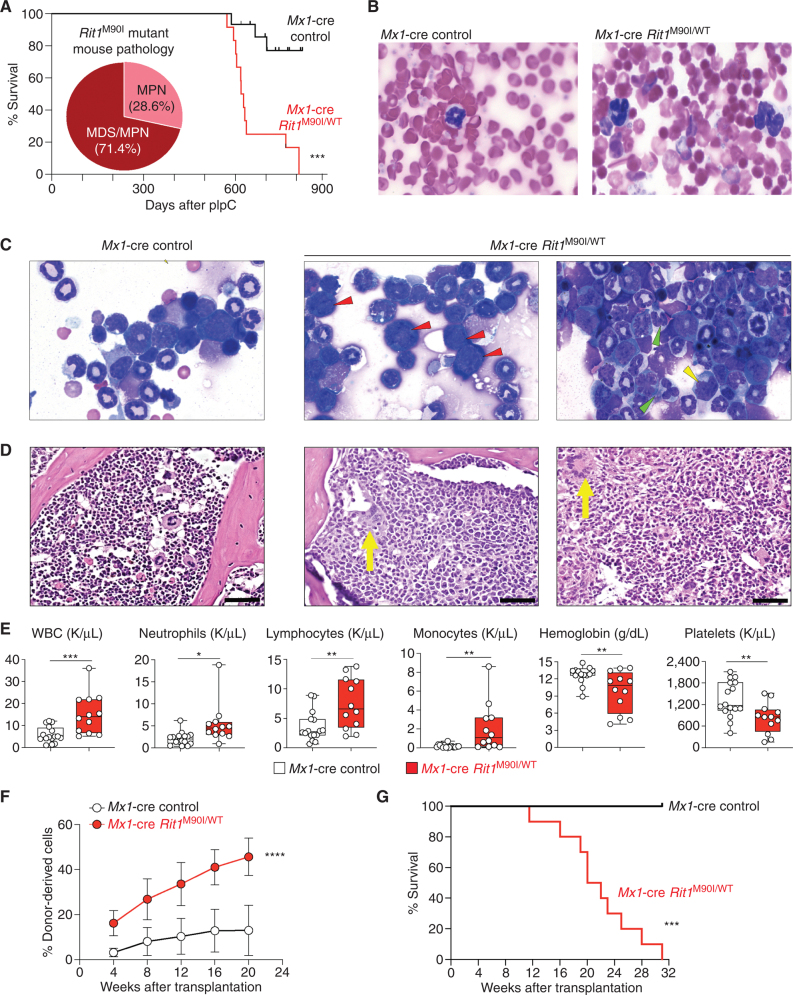
Figure 4.
Rit1 M90I/WT mutation drives the development of myeloid neoplasms in vivo. A, Kaplan–Meier curve of primary Mx1-cre Rit1M90I/WT mice following polyinosinic:polycytidylic acid (pIpC) treatment. Venn diagram indicates diagnoses of Rit1M90/+ mice at the time of death and proportion developing MPN and myelodysplasia/MPN (MDS/MPN). n = 12. ***, P < 0.001. Wright–Giemsa stain of peripheral blood (B) and bone marrow (C) cytospins of Mx1-cre control and Mx1-cre Rit1M90I/WT mice at the time of disease onset of the Rit1M90I/WT mice. Red arrows indicate dysplastic erythroid precursors. Green arrows indicate dysplastic neutrophils. Yellow arrow indicates dysplastic myeloid precursors. Two representative animals are shown for the Rit1M90I/WT mice. D, Hematoxylin–eosin stain of bone marrow (yellow arrows indicate dysplastic megakaryocytes; scale bars = 100 μm). Two representative animals are shown for the Rit1M90I/WT mice. E, Box-and-whisker plots of peripheral blood counts of primary Mx1-cre Rit1M90I/WT mice and their age-matched Mx1-cre control mice from A. For box-and-whisker plots, bar indicates median; box edges, first and third quartile values; and whisker edges, minimum and maximum values. n = 12. *, P < 0.05; **, P < 0.01; ***, P < 0.001. WBC, white blood cell. F, The percentage of CD45.2+ cells in peripheral blood of sublethally irradiated CD45.1+ recipient mice following transplantation of Mx1-cre Rit1M90/WT bone marrow cells from the time of disease onset from D. n = 5–10. Mean ± SD. ****, P < 0.001. G, Kaplan–Meier curve of CD45.1 recipient mice from F. n = 5–10. ***, P < 0.001.

