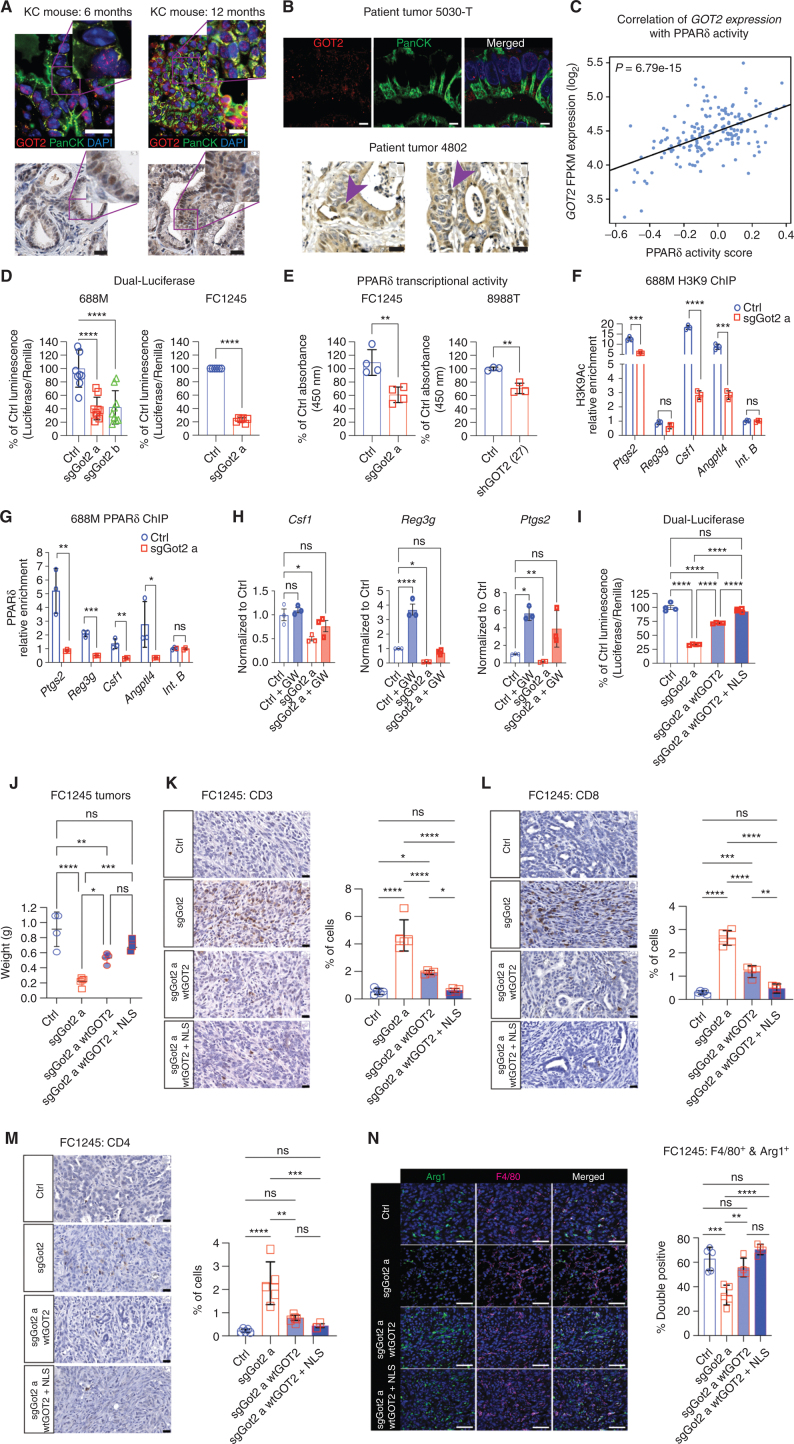
Figure 3.
GOT2 positively regulates PPARδ activity. A, IHC staining for GOT2 or GOT2 and panCK in pancreas tissues from KrasLSL-G12D/+;Pdx1-Cre (KC) mice at 6 or 12 months of age (representative of n = 4 per time point). Scale bars = 20 μm. B, IHC staining for GOT2 or GOT2 and panCK in human PDAC (representative of n = 5). Fluorescent images: scale bar = 5 μm, brightfield image: scale bar = 20 μm. Arrowheads indicate examples of tumor cells with nuclear GOT2. C, Scatter plot depicting the correlation of GOT2 expression with expression of PPARδ target genes in human PDAC per TCGA RNA-seq data (n = 177). FPKM, fragments per kilobase of transcript per million mapped reads. D, Luciferase assay for PPRE activity in the indicated cell lines, normalized to renilla, presented as mean ± SEM. ****, P < 0.0001 by one-way ANOVA (688M) or an unpaired t test (FC1245). E, PPARδ transcriptional activity assay, reading out binding to immobilized DNA containing PPREs, in the indicated cell lines. Data are presented as mean ± SEM from four (FC1245) or three (8988T) independent experiments. **, P < 0.01 by an unpaired t test. F and G, ChIP for H3K9Ac (F) and PPARδ (G) in control or sgGot2 688M PDAC cells, followed by qPCR for proximal promoter regions of the indicated genes. Data were normalized to an intergenic region (int. B) and are presented as mean ± SEM from biological triplicates. ns = not significant. *, P < 0.05; **, P < 0.01; ***, P < 0.001; ****, P < 0.0001 by an unpaired t test. H, qPCR for the indicated PPARδ-regulated genes in control or GOT2-knockdown PDAC cells, treated with vehicle (DMSO) or the PPARδ synthetic agonist GW501516 (GW; 100 nmol/L). Data are presented as mean ± SEM from biological triplicates. ns = not significant. *, P < 0.05; **, P < 0.01; ****, P < 0.0001 by one-way ANOVA. I, Luciferase assay for PPRE activity in sgGOT2 PDAC cells reconstituted with wild-type GOT2 (wtGOT2) or NLS-wtGOT2. Data are presented as mean ± SEM from four independent experiments. ns = not significant. ****, P < 0.0001 by one-way ANOVA. J, PDAC tumor weight at the experimental endpoint, 22 days after orthotopic transplantation of FC1245 cells into immune-competent hosts (n = 4–5 per arm). Data are presented as mean ± SEM. ns = not significant. *, P < 0.05; **, P < 0.01; ***, P < 0.001; ****, P < 0.0001 by one-way ANOVA. K–M, IHC staining and quantification of T-cell markers CD3, CD8, and CD4 in FC1245 tumors (n = 4–5 per arm, scale bars = 20 μm). Data are presented as mean ± SEM. ns = not significant. *, P < 0.05; **, P < 0.01; ***, P < 0.001; ****, P < 0.0001 by one-way ANOVA. N, IHC staining and quantification of CD68 and Arg1 in FC1245 tumors (n = 4–5 per arm, scale bars = 20 μm). Data are presented as mean ± SEM. ns = not significant. **, P < 0.01; ***, P < 0.001; ****, P < 0.0001 by one-way ANOVA.

