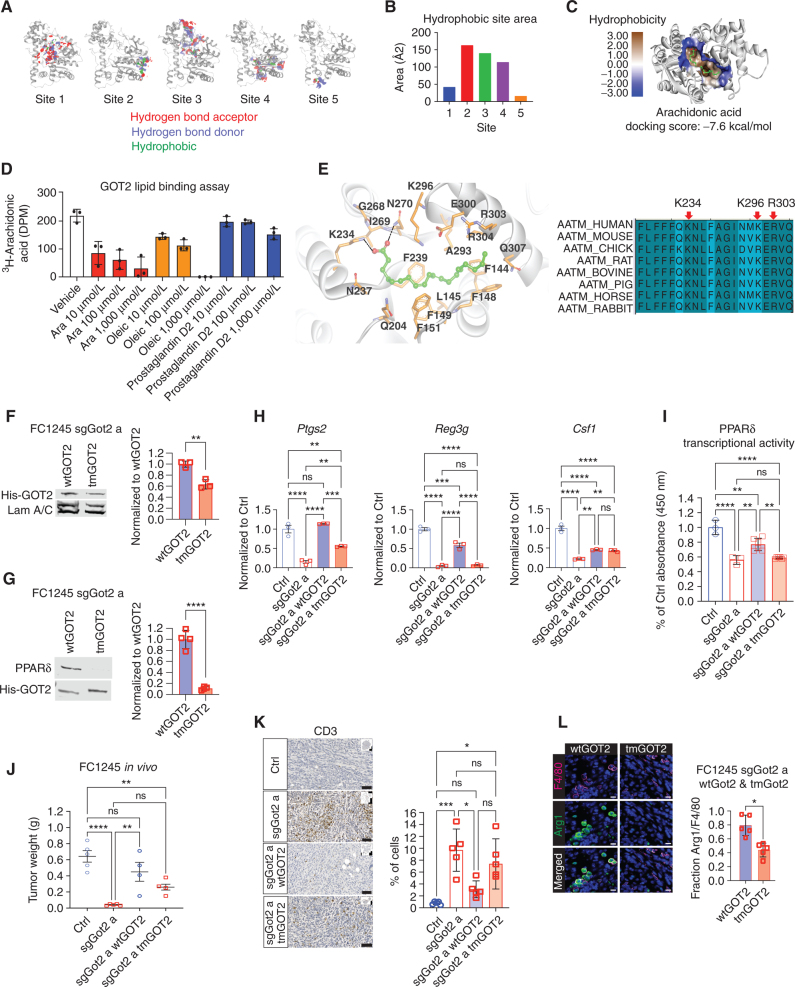
GOT2 binds to the PPARδ ligand directly. A, Hydrophobic site maps on the GOT2 protein, indicating putative fatty acid binding domains. Red: hydrogen bond acceptor, blue: hydrogen bond donor, green: hydrophobic. B, Plot of the hydrophobic area of the putative fatty acid binding sites depicted in A. C, Docking model of arachidonic acid in site 2 on the GOT2 protein, with bioenergetic docking score (−7.6 kcal/mol) indicated below. D, Competitive fatty acid binding assay measuring radioactivity upon incubating purified human GOT2 with 3H-arachidonic acid (1 μmol/L) and the indicated concentrations of cold lipid species. Ara, cold arachidonic acid. E, Left, model of arachidonic acid bound to GOT2, indicating amino acid residues that potentially facilitate binding. Based on this model, K234, K296, and R303 were selected for mutation to alanine. Right, conservation of GOT2 amino acid sequence, including the three residues predicted to support arachidonic acid binding, among higher vertebrates. F, Western blots indicating nuclear and whole-cell abundance of wtGOT2 and tmGOT2 (both His-tagged) in reconstituted sgGOT2 FC1245 PDAC cells. Nuclear GOT2 quantification appears to the right. **, P < 0.01 by an unpaired t test. G, Western blots from whole-cell lysates or His pulldowns from the cells depicted in F. ****, P < 0.0001 by an unpaired t test. H, qPCR for the indicated PPARδ-regulated genes in FC1245 stable cell lines, normalized to 36b4. Data are presented as mean ± SEM from biological triplicates. ns = not significant. **, P < 0.01; ***, P < 0.001; ****, P < 0.0001 by one-way ANOVA. I, PPARδ transcriptional activity assay in the indicated FC1245 stable cell lines. Data are presented as mean ± SEM from three to six biological replicates. ns = not significant. **, P < 0.01; ****, P < 0.0001 by one-way ANOVA. J, PDAC tumor weight at the experimental endpoint, 18 days after orthotopic transplantation of the indicated FC1245 cells. Ctrl: n = 5, sgGot2 a: n = 5, sgGot2 a + wtGOT2: n = 4, sgGot2 a + tmGOT2: n = 5. Ctrl and sgGot2 arms here are also depicted in Fig. 1E. Data are presented as mean ± SEM. ns = not significant. **, P < 0.01; ****, P < 0.0001 by one-way ANOVA. K and L, IHC staining (scale bars = 50 μm) and quantification for T cells (K; CD3) and macrophages (L; F4/80 and Arg1) in PDAC harboring wtGOT2 or tmGOT2 (n = 5 per arm). Data are presented as mean ± SEM. ns = not significant. *, P < 0.05; ***, P < 0.001 by one-way ANOVA (K) or an unpaired t test (L).

An official website of the United States government
Here's how you know
Official websites use .gov
A
.gov website belongs to an official
government organization in the United States.
Secure .gov websites use HTTPS
A lock (
) or https:// means you've safely
connected to the .gov website. Share sensitive
information only on official, secure websites.
