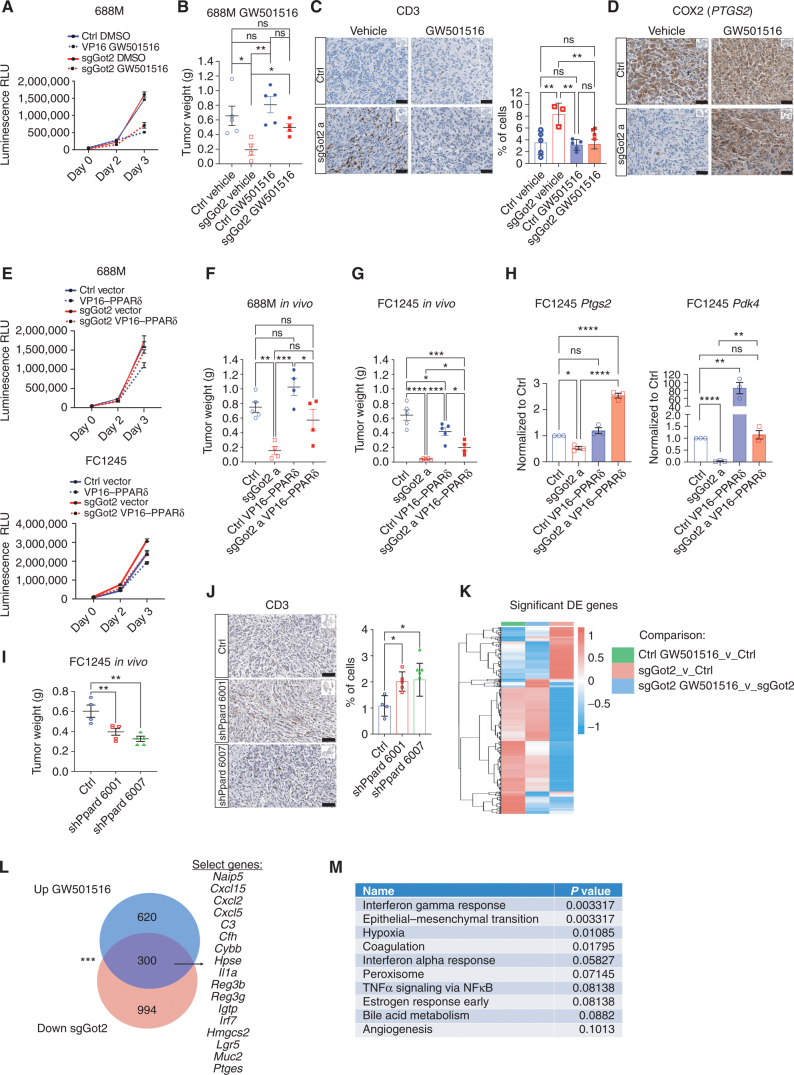
Figure 5.
PPARδ activation restores tumor growth and T-cell exclusion in the absence of GOT2. A, Viable cell measurements in control or sgGot2 PDAC cells treated with vehicle or 100 nmol/L GW501516. RLU, relative light unit. B, PDAC tumor weight at the experimental endpoint, 30 days after orthotopic transplantation of the control or sgGot2 cells, with daily i.p. injection of vehicle or 4 mg/kg GW501516. Ctrl: n = 5 per cohort, sgGot2: n = 4 per cohort. Data are presented as mean ± SEM. ns = not significant. *, P < 0.05; **, P < 0.01 by one-way ANOVA. C, IHC staining of control and sgGot2 688M tumors treated with vehicle or GW501516 as in B for the T-cell marker CD3. Representative images are shown above (scale bars = 50 μm), with quantification below (ctrl: n = 5, ctrl + GW501516: n = 5, sgGot2: n = 3, sgGot2 + GW501516: n = 4). Data are presented as mean ± SEM. ns = not significant. **, P < 0.01 by one-way ANOVA. D, IHC staining for PTGS2/COX2 in control or sgGot2 PDAC treated with vehicle or GW501516 (representative of n = 3–5 per cohort). Scale bars = 50 μm. E, Viable cell measurements in control or sgGot2 PDAC cells stably transduced with empty vector or VP16–PPARδ. Data are presented as mean ± SEM. F and G, PDAC tumor weight at the experimental endpoint in the indicated 688M (F) and FC1245 (G) lines. 688M: Ctrl: n = 5, sgGot2 a: n = 4, ctrl VP16–PPARδ: n = 4, sgGot2 a VP16–PPARδ: n = 4, endpoint = day 27. FC1245: Ctrl: n = 5, sgGot2 a: n = 5, ctrl VP16–PPARδ: n = 5, sgGot2 a VP16–PPARδ: n = 4, endpoint = day 18. Ctrl and sgGot2 FC1245 arms here are also depicted in Fig. 1E. ns = not significant. *, P < 0.05; **, P < 0.01; ***, P < 0.001; ****, P < 0.0001 by one-way ANOVA. H, qPCR for PPARδ-regulated genes in the indicated FC1245 stable cell lines, normalized to 36b4. Data are presented as mean ± SEM from biological triplicates. *, P < 0.05; **, P < 0.01; ****, P < 0.0001 by one-way ANOVA. I, PDAC tumor weight at experimental endpoint (day 18) in ctrl (n = 4) and shPpard (n = 5 per hairpin) FC1245 tumors. **, P < 0.01 by one-way ANOVA. J, Quantification of CD3 IHC on the tumors from I (scale bars = 50 μm). ns = not significant. *, P < 0.05 by one-way ANOVA. K, Heat map depicting differentially expressed (DE) genes in control and sgGot2 FC1245 PDAC cells, untreated or treated with 500 nmol/L GW501516 for 24 hours (n = 3 per group), identified by RNA-seq using cutoff criteria Padj < 0.01 and logFC < −1 or > 1 in at least one comparison. L, Venn diagram showing RNA-seq results by the criteria in K, with sample gene identities at the overlap listed. Overlapping gene frequency: ***, P < 0.001 by permutation test. M, Molecular Signatures Database (MSigDB) pathway analysis showing the top 10 enriched pathways of genes at the overlap in L.

