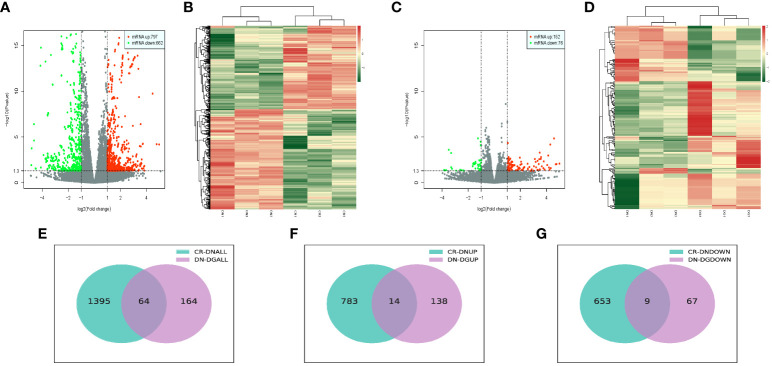
Figure 3.
Differentially expressed mRNAs in DN (n=3). (A, B) Volcano plots (A) and heatmaps (B) for comparison between CR and DN. (C, D) Volcano plots (C) and heatmaps (D) for comparison between DN and DG. (E) Overlap of the differentially expressed mRNAs in the comparisons between CR vs DN and DN vs DG. (F) Upregulated differentially expressed mRNAs in the comparisons between CR vs DN and DN vs DG. (G) Downregulated differentially expressed mRNAs in the comparisons between CR vs DN and DN vs DG. CR, control group; DN, diabetic nephropathy group; DG, dapagliflozin group.

