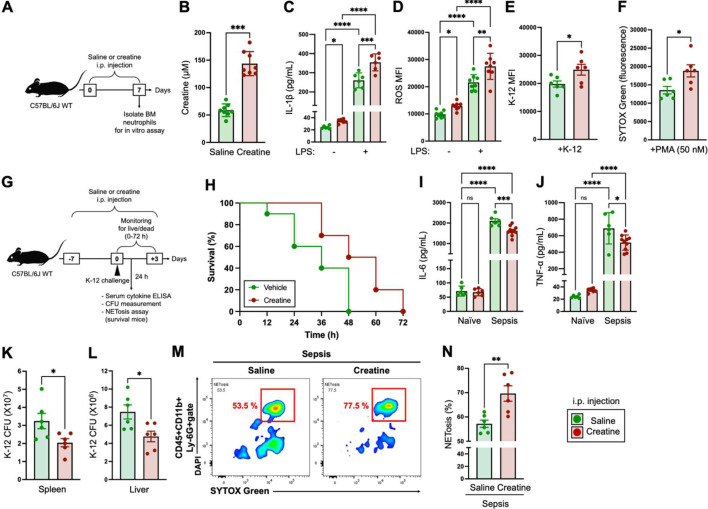
Fig. 2.
In vivo creatine supplementation enhances the immunological activity of neutrophils and establishes an environment resistant to bacterial sepsis.
A) Design of in vivo creatine supplementation. The mice (n=8 in each group) received an i.p. injection of saline (200 µL) or creatine (200 µL of 50 mg/mL in saline) every 24 hr for 7 days. After completion of the administration procedures, neutrophils were isolated from bone marrow (BM) and used for subsequent in vitro experiments. B) Serum creatine concentrations of mice i.p. injected with saline or creatine at day 7. C) IL-1β production in neutrophils. Neutrophils (1.0×10⁷/mL) were treated with the vehicle control (−, PBS) or lipopolysaccharide (LPS) (100 ng/mL) at 37°C overnight. The concentration of IL-1β in the culture medium was measured by ELISA. D) reactive oxygen species (ROS) production in neutrophils. Neutrophils (1.0×10⁷/mL) were treated with the vehicle control (−, PBS) or LPS (100 ng/mL) at 37°C for 60 min. The ROS production was analyzed by flow cytometry. E) Phagocytosis activity in neutrophils. Neutrophils (1.0×10⁷/mL) were incubated with E. coli K-12 BioParticles (100 µg/mL) at 37°C for 120 min. The phagocytosis activity against K-12 was analyzed by flow cytometry. F) NETosis of PMA-treated neutrophils. Neutrophils (5.0×10⁵/mL) were treated with PMA (50 nM) at 37°C for 4 hr. The cell-free DNA (CFD) in the cultured medium was stained with SYTOXTM Green, and the fluorescence was analyzed with a microplate reader. G) Design of the bacterial sepsis model. The mice (n=10 in each group) received an i.p. injection of saline (200 µL) or creatine (200 µL of 50 mg/mL in saline) every 24 hr for 7 days (days −7 to 0). Live E. coli K-12 (100 µL of 1.0×10⁹ CFU/mL of suspension in saline) was i.p. injected into the mice (at day 0). The numbers of live and dead mice in each group were monitored every 12 hr up to 72 hr (days 0 to +3). Plasma cytokine concentration, K-12 CFU in organs, and NETosis in peripheral blood circulating neutrophils were analyzed in the surviving mice at 24 hr post-challenge with K-12. H) Survival curve of bacterial sepsis mice. I, J) Serum cytokine levels in sepsis mice. The serum samples were collected from surviving mice at 24 hr post-challenge with K-12, and IL-6 (I) and TNF-α (J) concentrations were measured by ELISA. K–L) Bacteria colonization in organs of sepsis mice. The spleen and liver were extracted from surviving mice at 24 hr post-challenge with K-12 (a different group of mice from those used for live/dead monitoring). The K-12 CFUs in whole organs were measured in the spleen (K) and liver (L), respectively. M, N) NETosis activity of blood circulating neutrophils. Peripheral blood was collected from surviving mice at 24 hr post-challenge with K-12, and NETosis in neutrophils was analyzed by flow cytometry. The SYTOXTM Green+DAPI+ population in the CD45+CD11b+Ly-6G+ gate was determined to comprise NETosis neutrophils. L) Representative image of NETosis neutrophils in the flow cytometry analysis. M) Cumulative data for the percentage of NETosis neutrophils. The cumulative data are shown as mean ± SEM values of six or eight samples in two independent experiments. Student’s t-test (B, E, F, K, L, N) or one-way ANOVA (C, D, I, J) was used to analyze data for significant differences. Asterisks indicate significance: *p<0.05, **p<0.01, ***p<0.001, ****p<0.0001. ns, not significant.

