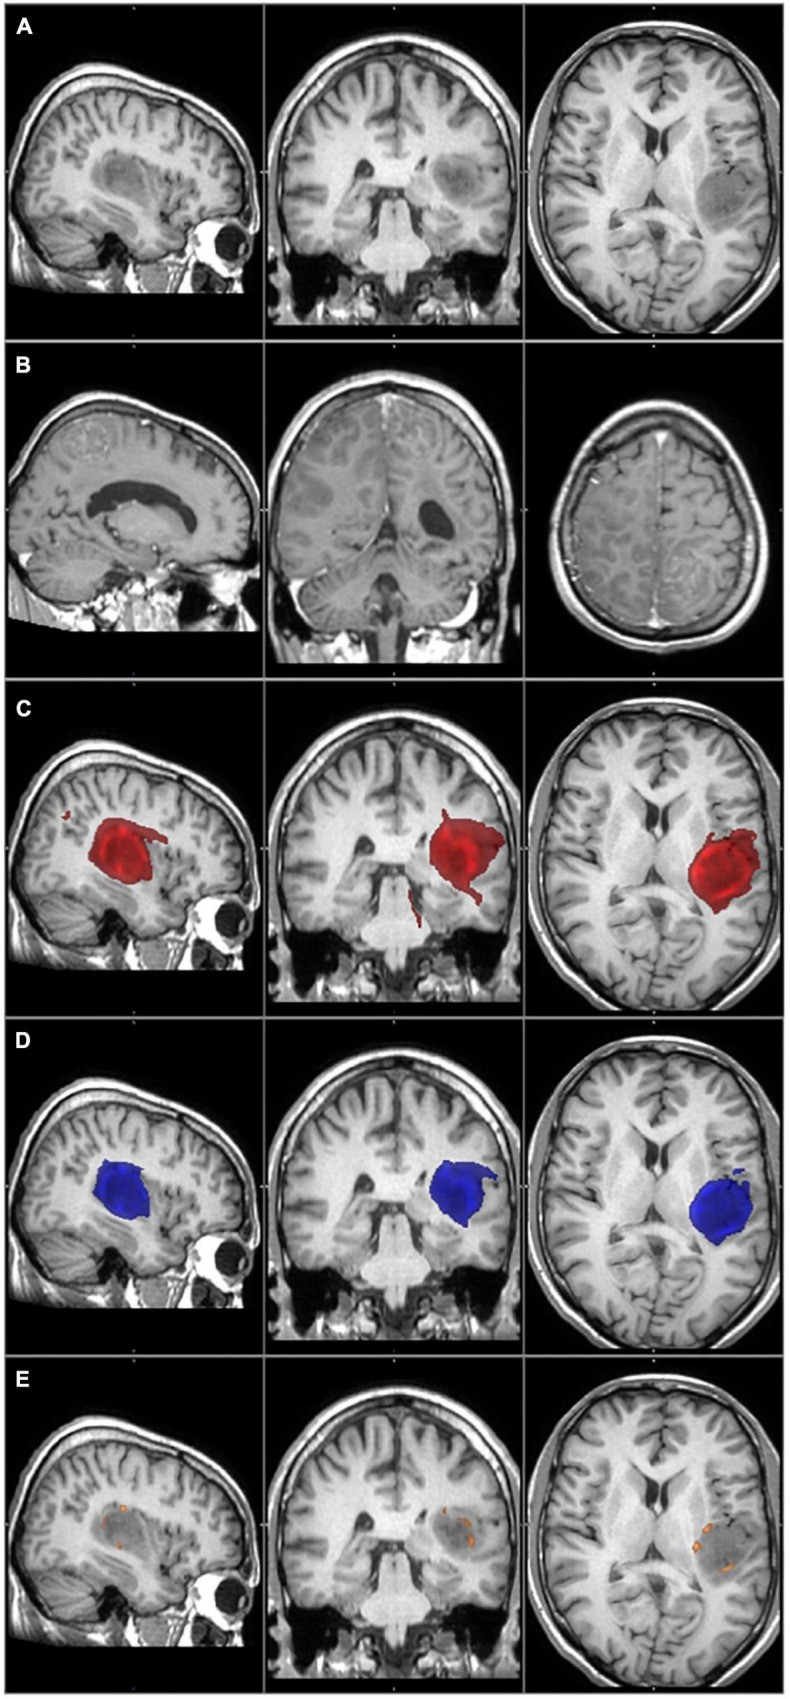
FIGURE 3.

The primary tumor, the recurrence tumor, and the overlap between the different TCs and the tumor recurrence mask of the representative case of Patient 1 are displayed in this figure. All images are transformed to the MNI152 1 mm space. (A) The preoperative contrast enhanced T1 image. The tumor is located in the left temporo-parietal region and does not enhance the contrast agent, but histology verified the glioblastoma. (B) The size and the location of the tumor recurrence. (C) The 1% TC (red) is overlapped on the tumor recurrence mask (green). (D) The 5% TC (blue) is overlapped on the tumor recurrence mask (green). (E) The 40% TC (red-yellow) is overlapped on the tumor recurrence mask (green). (C–E) Are on the preoperative T1 images. The main part of the recurrence is far away from the original tumor location, which leads to very low sensitivity even at the 1% threshold level.
