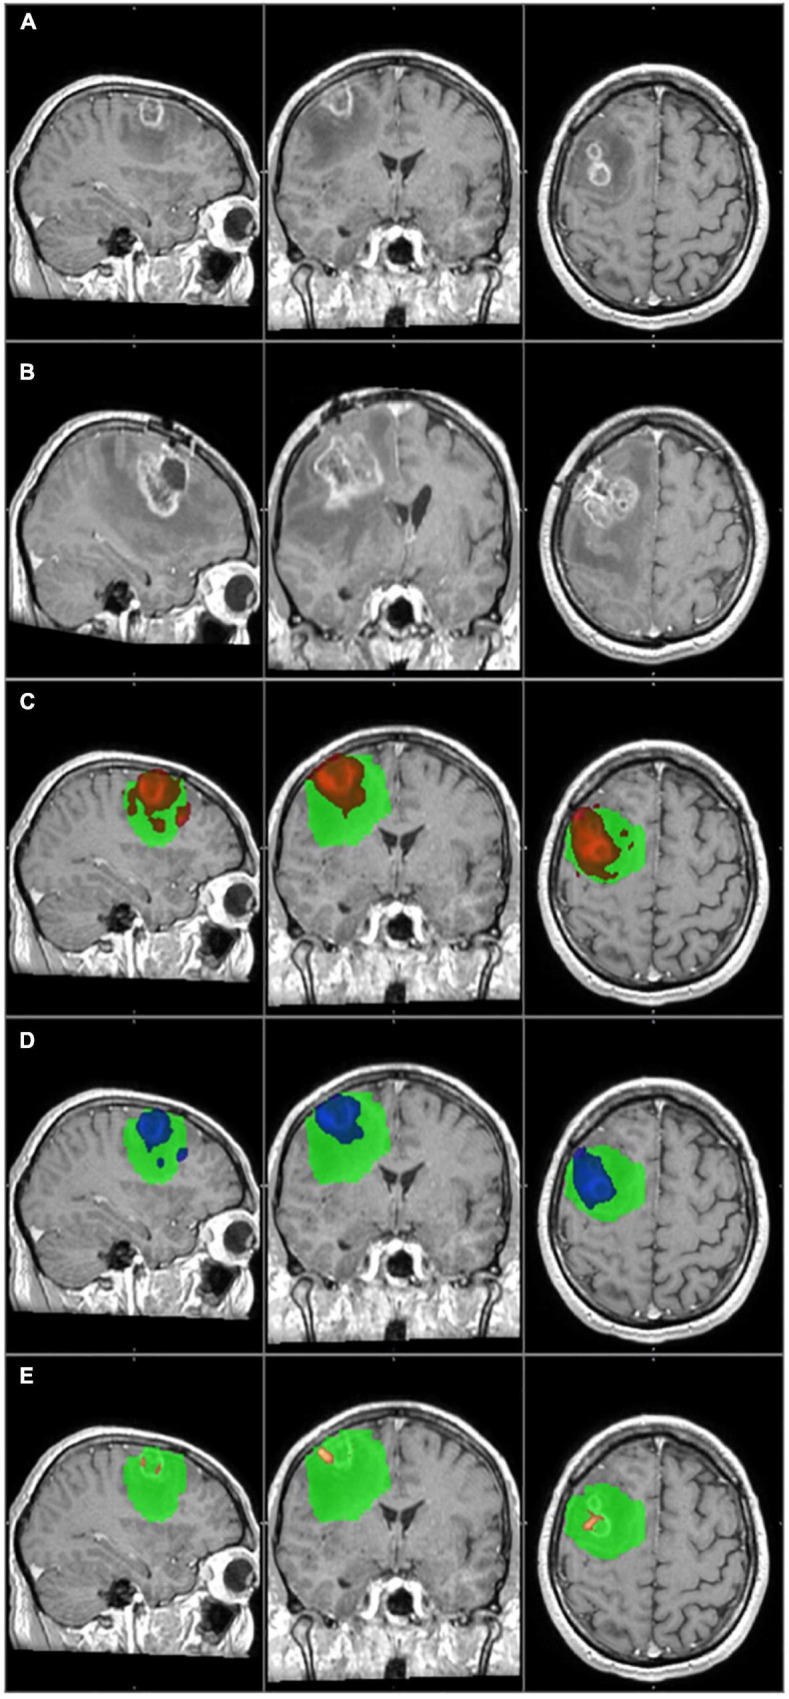
FIGURE 4.

The primary tumor, the recurrence tumor, and the overlap between the different TCs and the tumor recurrence mask of the representative case of Patient 20 are displayed in this figure. All images are transformed to the MNI152 1 mm space. (A) The preoperative contrast enhanced T1 image. Two small tumors with ring shaped contrast enhancement can be seen in the right frontal region. (B) The size and the location of the tumor recurrence. (C) The 1% TC (red) is overlapped on the tumor recurrence mask (green). (D) The 5% TC (blue) is overlapped on the tumor recurrence mask (green). (E) The 40% TC (red-yellow) is overlapped on the tumor recurrence mask (green). (C–E) Are on the preoperative T1 images. As it can be seen, the TCs are fully overlapping with the tumor recurrence mask and therefore the specificity is 100% at every threshold. On the other hand the recurrence remarkably exceeds the border of the TCs, and the sensitivity is low, even at 1%. Please note that the direction of the recurrence is in correspondence with the TCs, and the low sensitivity is the result of the fast tumor progression.
