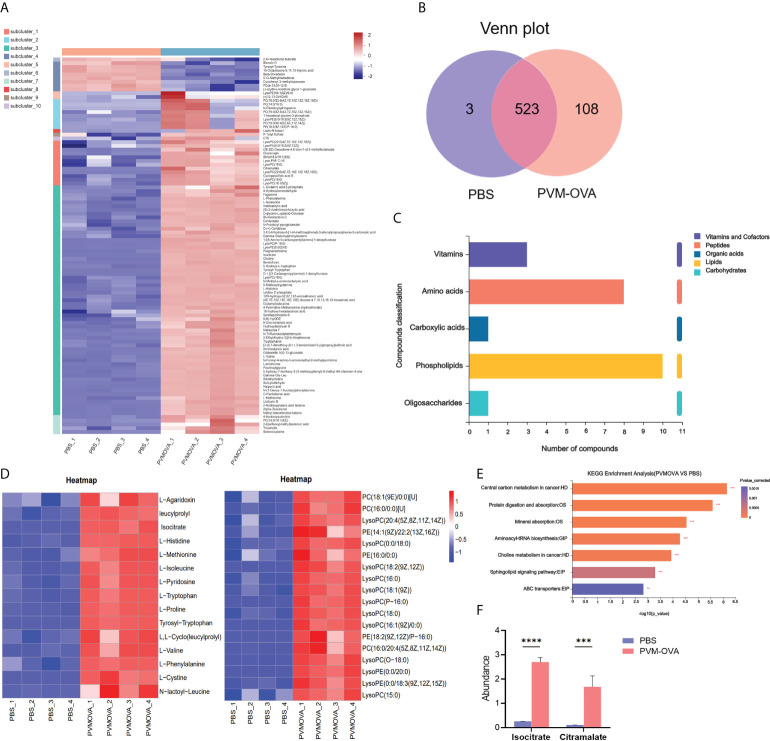
Figure 3.
Lung CD11b+ trained macrophages undergo metabolic reprogramming. (A) Heat map of differential metabolites of PVM-OVA group vs PBS group. (B) Venn plot of the numbers of different metabolites among groups. The diagram shows overlapping and distinct metabolites indicated by the numbers in the intersections and circles, respectively. (C) KEGG compound classification of differential metabolites. (D) Heat maps of differential metabolite amino acids or phospholipids. (E) KEGG pathway enrichment analysis. (F) The abundance of metabolites related to TCA cycle. ***P<0.001, ****P<0.0001.

