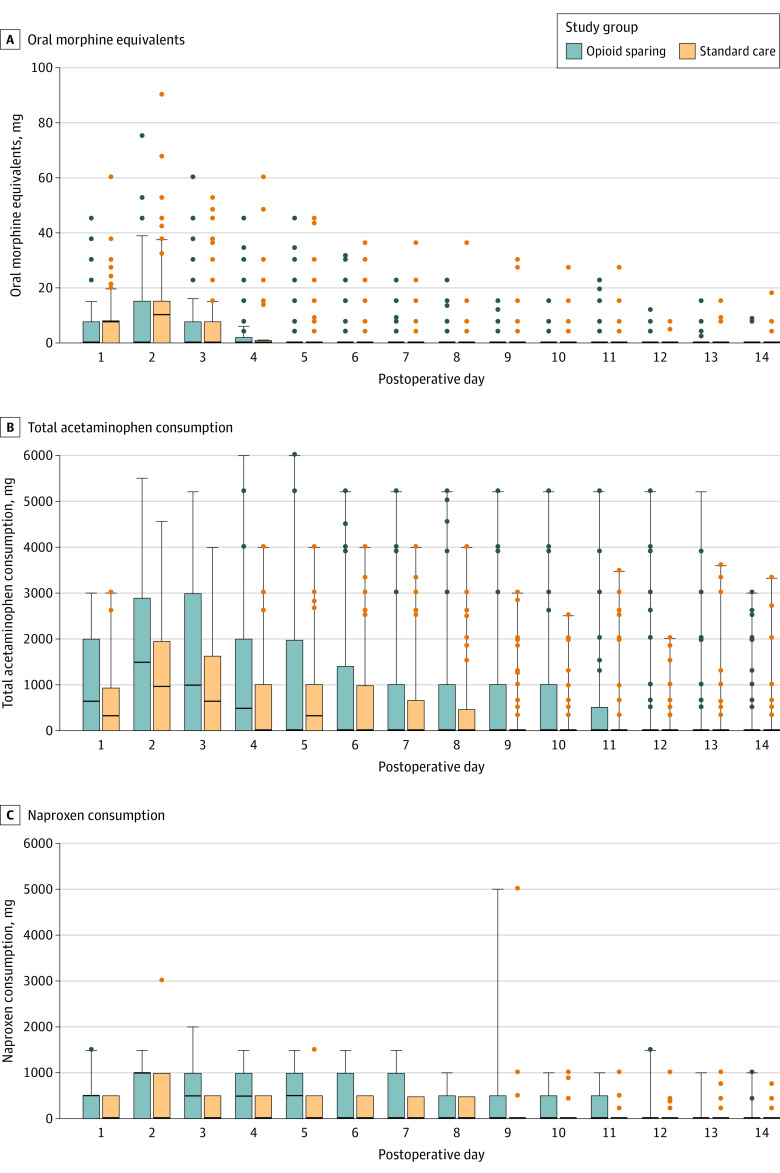
Figure 2. Pain Medication Consumption Over First 14 Days After Surgery.
Whiskers indicate quartile 3 plus 1.5 times the IQR; bars, IQR (quartile 1 to quartile 3); the dots, outlying values; black lines, medians. The sample sizes for all data points are 95 for the opioid-sparing group and 98 for standard care group.

