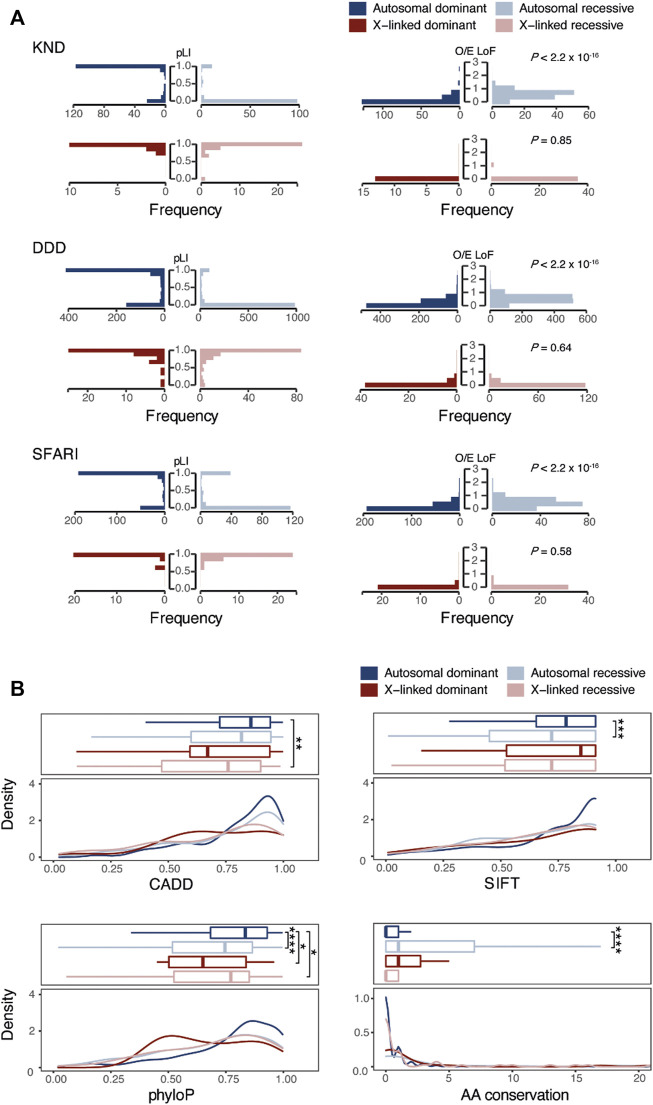
FIGURE 3.
Comparison of genetic characteristics of genes and variants that follow dominant or recessive inheritance. (A) Comparison of pLI or O/E scores of NDD causal genes across inheritance patterns. (B) Comparison of functional (CADD, SIFT, and phyloP) and conservation scores among NDD causal variants according to inheritance patterns. “AA conservation” denotes the number of species with different amino acids in 99 human ortholog proteins. *, p-value < 0.1, **, p-value < 0.01, ***, p-value < 0.001. ****, p-value < 0.00001.

