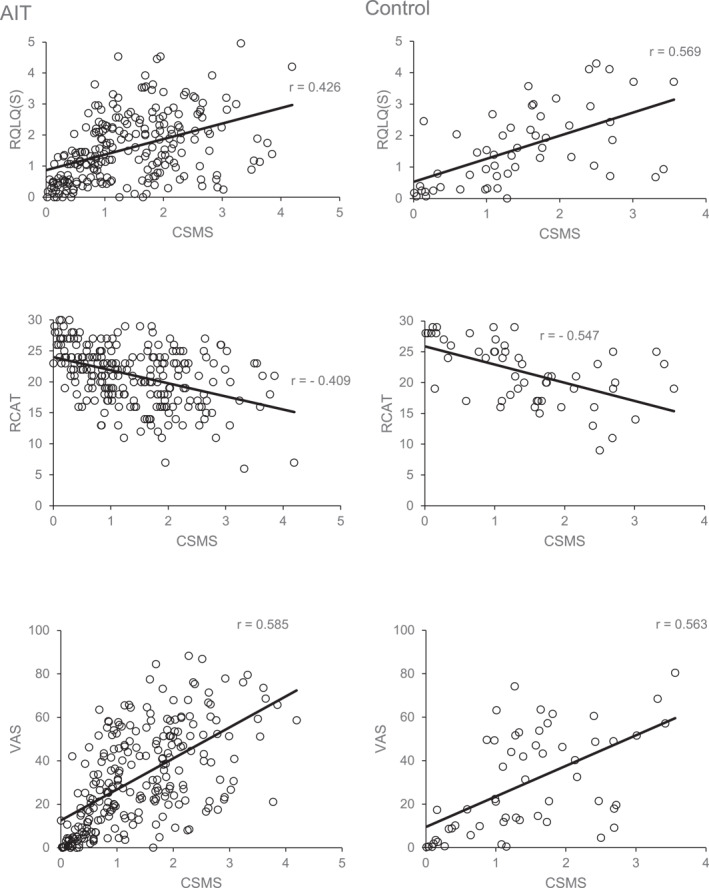
FIGURE 1.

Correlation graphs. These graphs show the correlations between the combined symptom and medication score (CSMS) and each validated questionnaire used in the two populations. CSMS, Combined Symptom and Medication Score; RCAT, Rhinitis Control Assessment Test; RQLQ(S), Standardised Rhinoconjunctivitis Quality of Life Questionnaire; VAS, Visual Analogue Scale of overall impairment by allergic rhinoconjunctivitis symptoms
