
Figure 1. Clustering of single-cell transcriptomes reveals two distinct states of Vδ1+ cells reminiscent of effector and naive phenotypes.
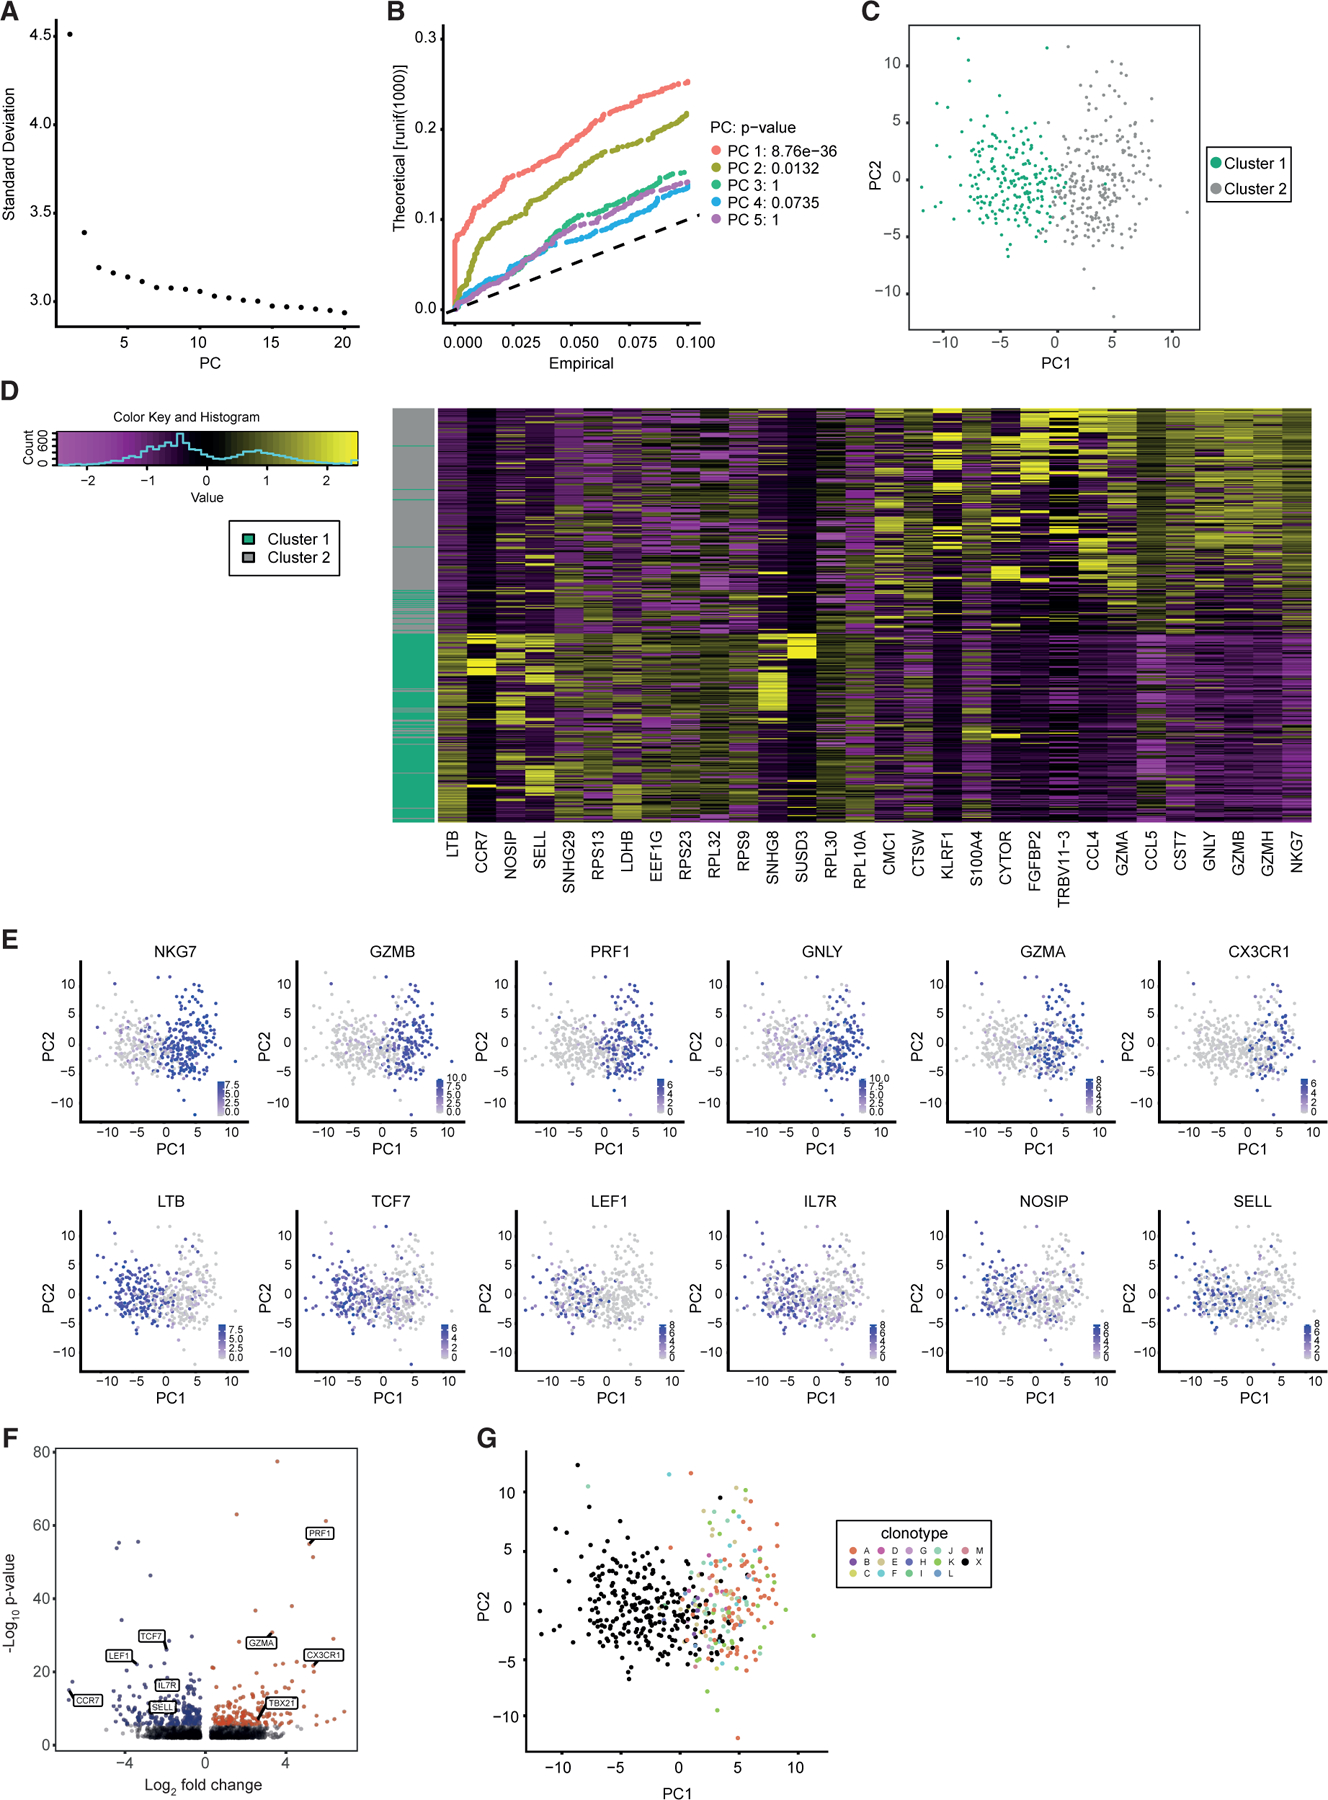
(A and B) Principal-component analysis was performed on single-cell RNA sequencing data from 447 FACS-sorted Vδ1+ cells (CD27hi versus CD27lo/neg) from three donors. (A) An elbow plot was constructed using the 20 dimensions. An ‘‘elbow’’ is observed at PC2. (B) A JackStraw plot was used to investigate the top 5 principal components (PCs). PC1 and PC2 were significant and used for visualization.
(C) Shared nearest neighbor clustering was used to find clusters in the data. Two clusters were found and colored.
(D) A heatmap was created using the top 30 genes contributing to the differences between cluster 1 and 2 (PC1). An even number of positive and negative factors are shown. These highlight genes previously shown to be associated with effector or naive status.
(E) Expression of genes previously shown to be associated with either effector (top) or naive (bottom) status were projected onto the PCA plot. Purple indicates higher expression.
(F) Differential gene expression between cluster 1 (blue) and cluster 2 (red) cells revealed 368 differentially expressed genes. Only those that had a LogFC greater than 0.25 and an adjusted p value of less than 0.05 were colored (Bonferroni corrected). Notable genes previously associated with effector or naive status are labeled.
(G) TCR clonality analysis. Thirteen expanded clonotypes were identified by the analysis (clones A–M), and projected onto the PCA taken from (B). ‘‘X’’ represents cells with a unique TCR sequence. Cells bearing expanded clonotypes fall within CD27lo/neg sorted cells and almost exclusively within the ‘‘Teffector’’ cluster (cluster 2).