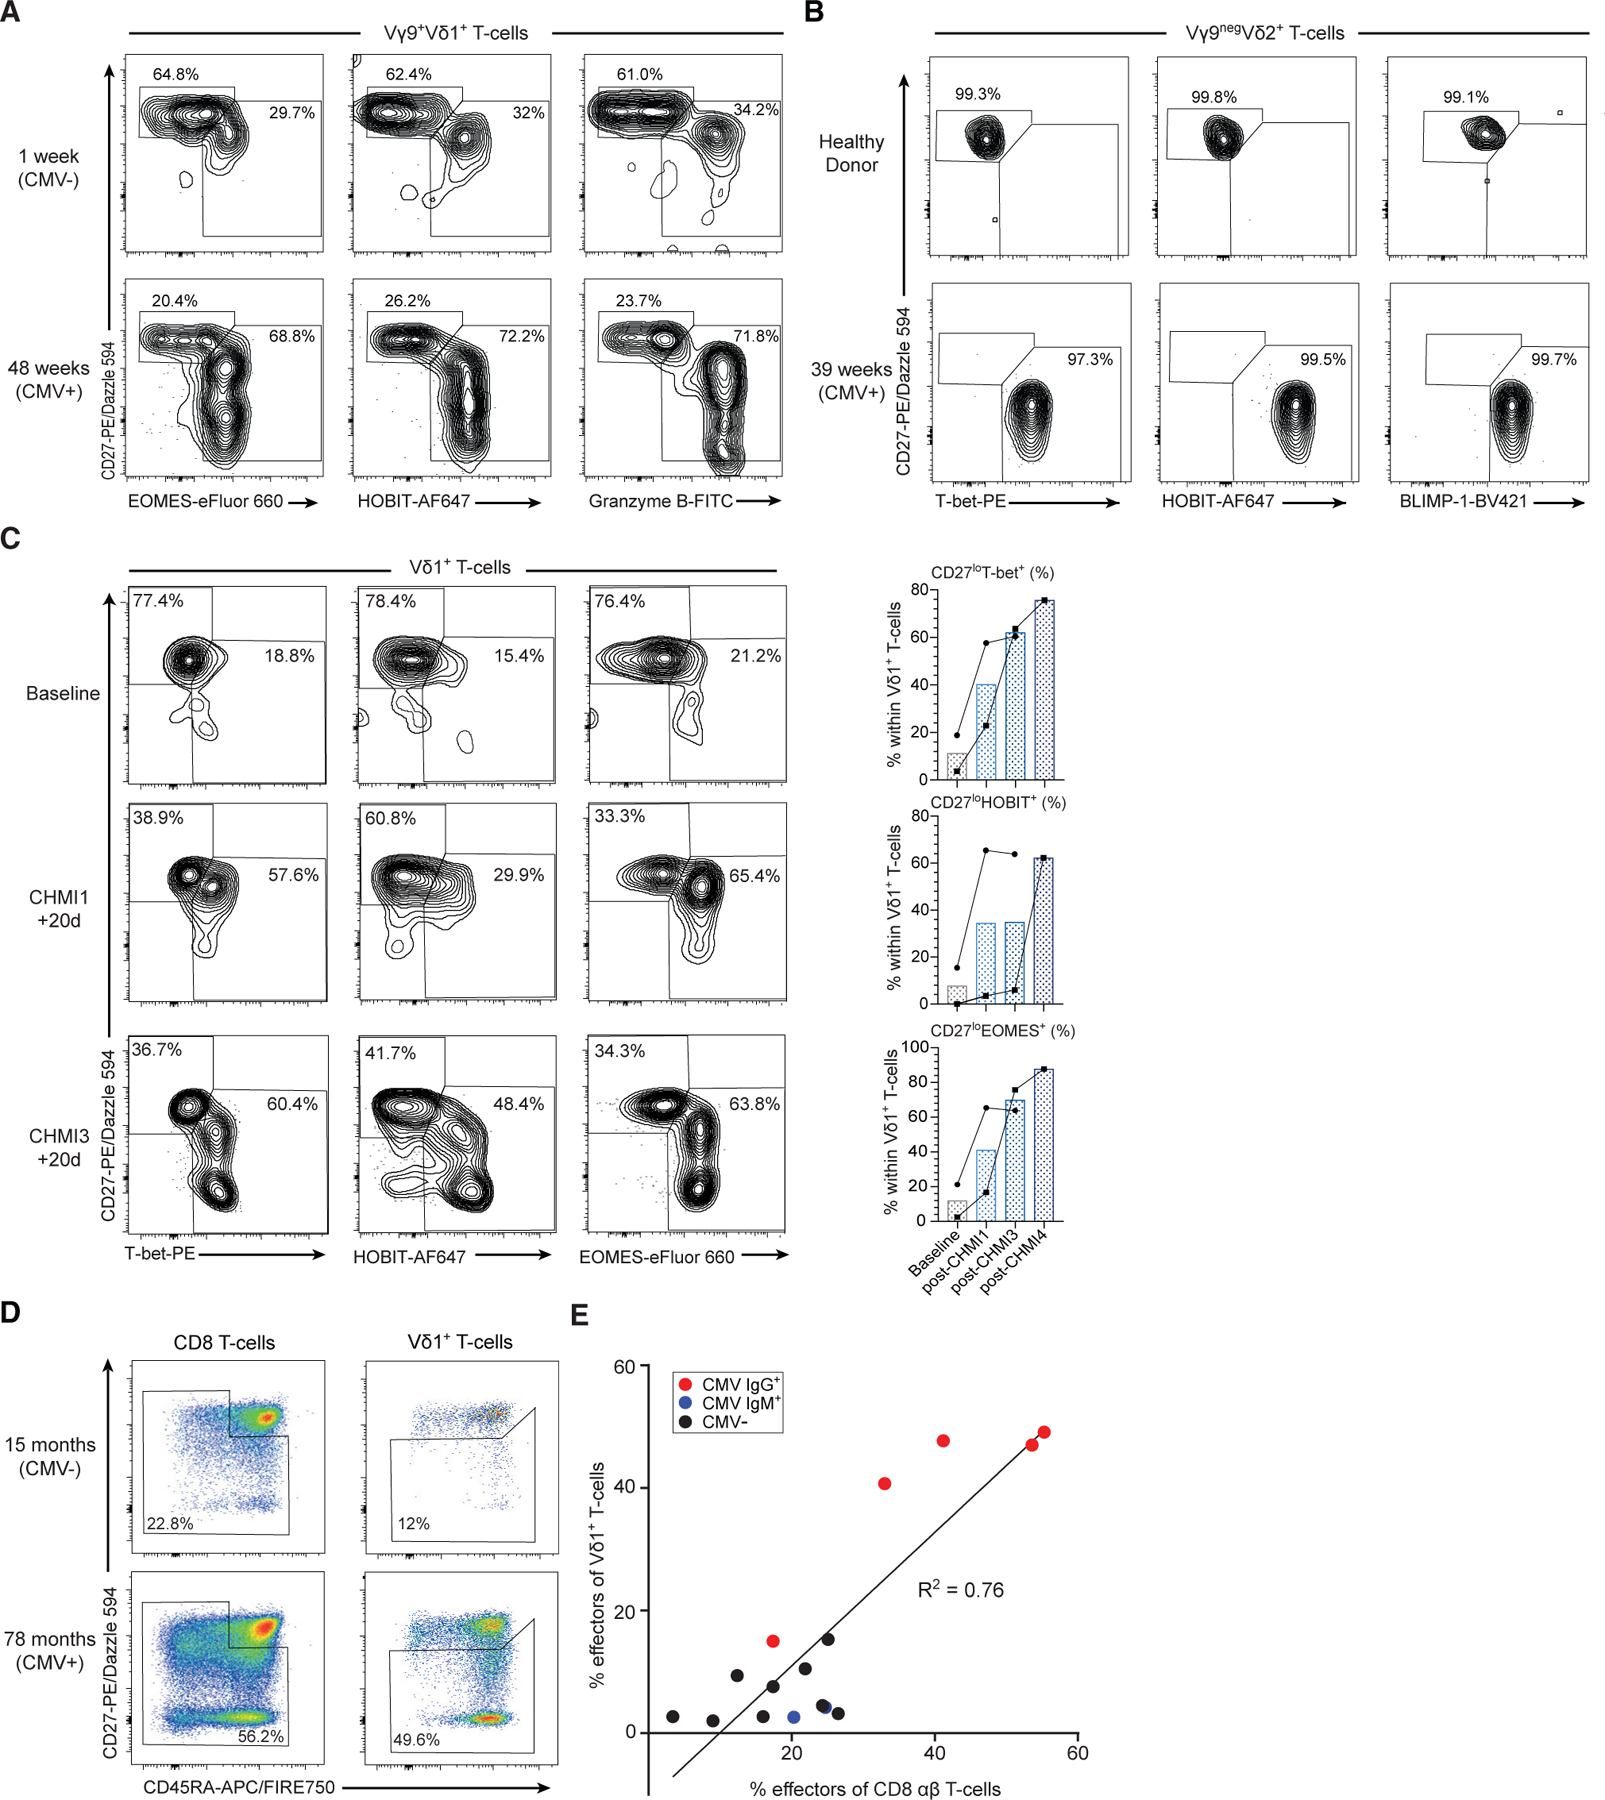
Figure 6. Adaptive differentiation of human γδ T cells in vivo.

(A) Transition of Vγ9+Vδ1+ T cells to a Teffector transcriptional program following CMV infection after kidney transplantation involving increased Eomes+, HOBIT+, and granzyme B+ Teffector cells.
(B) Vγ9negVδ2+ T cells transition from a predominantly CD27hi, T-betneg, HOBITneg, BLIMP-1neg phenotype to a CD27lo/neg, T-bet+, HOBIT+, BLIMP-1+ phenotype 39 weeks post-CMV infection.
(C) Transition of Vδ1+ T cells from a Tnaive to a Teffector transcriptional program following consecutive controlled human malaria challenge (CHMI) in two malarianaive individuals. (Left panel) Flow cytometry plots from one individual showing baseline (malaria naive), CHMI challenge 1 + 20 days after first infection and CHMI challenge 3 + 20 days and measure expression of T-bet, HOBIT, and Eomes versus CD27. (Right panel) Frequencies of T-bet+, HOBIT+, and Eomes+ Vδ1+ T cells from the same individual and second individual undergoing CHMI.
(D) Assessment of Vδ1+ Teffector (CD27lo/neg) and CD8+ effector (TCM + TEM + TEMRA) cells in 16 healthy children (aged 12 months to 12 years).
(E) Percentage of CD27lo/neg Vδ1+ cells correlates with percentage of CD8+ effector αβ T cells (R2 = 0.76, Spearman coefficient = 0.73, p = 0.0017).
