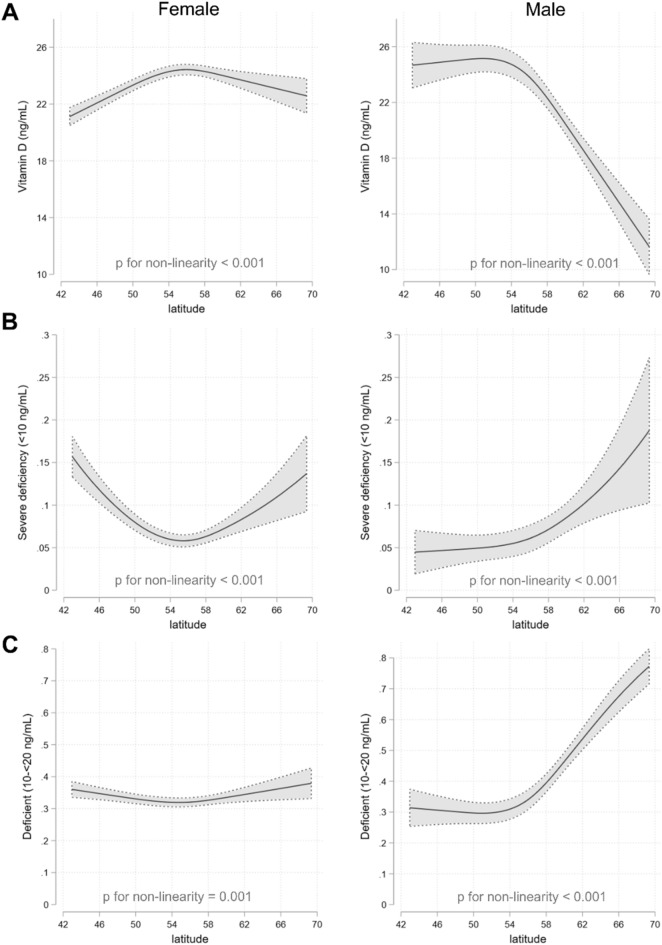
Figure 3.
Restricted cubic splines showing association between latitude and mean 25(OH)D concentrations (A), proportion with severe deficiency (< 10 ng/mL) (B) and proportion with deficiency (10- < 20 ng/mL) (C). Shaded gray area represent 95% confidence intervals. Analyses are adjusted for age group, season and year of data collection. Data are from 2013 to 2018 and are from all months of the year. For all outcomes the p-value for interaction between latitude and sex was < 0.001.

