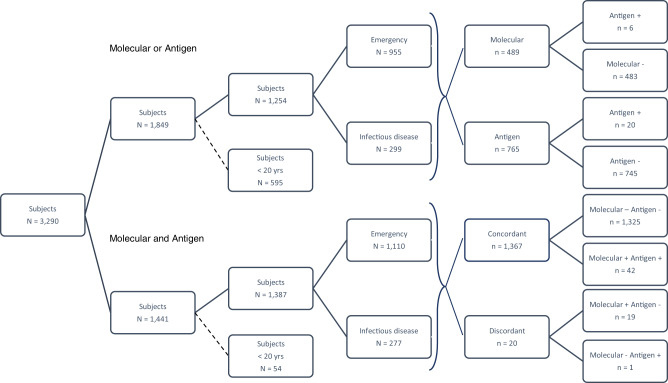
Fig. 1. Diagram of admissions to hospital wards.
Diagram showing the total number of patients from emergency and the infectious diseases wards tested with either a molecular or antigen diagnostic test and with both molecular and antigen tests in the period from 15 September to 16 October 2020. Subjects who underwent either antigen or molecular are further subdivided into the corresponding test group with test results. Subjects who underwent both tests are further arranged in four groups according to test result concordance (molecular –/+ antigen –/+). Subjects under 20 were excluded from the hospital surveillance study.

