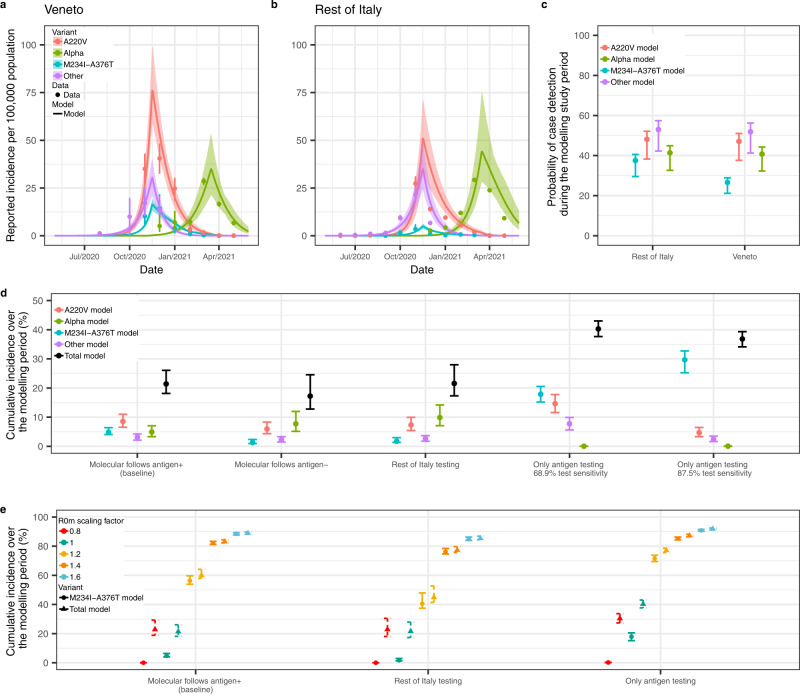
Fig. 5. Transmission dynamics of SARS-CoV-2 variants (A220V, M234I-A376T, Alpha and others) in Veneto and the rest of Italy, and cumulative incidences under different counterfactual testing scenarios.
a Veneto and b the rest of Italy estimated daily reported incidences per 100,000 population of A220V, M234I-A376T, Alpha and other virus variants, fitted from observed incidence data assuming a Negative Binomial likelihood (point and 95% binomial CI). Estimates are the mean and 95% CrI (solid line and shaded region), obtained from the 2.5% and 97.5% percentiles of 100 samples of the posterior distributions. c Probability of detecting cases attributable to the A220V, M234I-A376T, Alpha or other virus variants in Veneto and the rest of Italy during the modelling study period. Point and error bars are the mean and 95% CrI obtained from the 2.5% and 97.5% percentiles of 100 samples of the posterior distributions. d Cumulative A220V, M234I-A376T, Alpha, other virus variants and total incidence (%) in Veneto during the modelling study period, under different counterfactual testing scenarios. e Cumulative M234I-A376T variant and total incidence (%) in Veneto during the modelling study period, under different counterfactual testing scenarios. The R0 of the M234I-A376T variant is multiplied by different scaling factors: 0.8, 1 (baseline), 1.2, 1.4, 1.6. The counterfactual testing scenarios are as follows: molecular follows antigen + is the baseline testing scenario conducted in Veneto; molecular follows antigen – assumes negative antigen tests are followed up with a molecular test; Italy testing assumes the proportion of antigen and molecular tests conducted in Veneto was the same as the rest of Italy over the modelling study period; only antigen testing, 68.9% test sensitivity assumes infections are tested with an antigen test of 68.9% sensitivity (without molecular confirmation); only antigen testing 87.5% test sensitivity assumes infections are tested with an antigen test of 87.5% sensitivity (without molecular confirmation). Point and error bars are the mean and 95% CrI obtained from the 2.5% and 97.5% percentiles of 100 samples of the posterior distributions. CI confidence interval, CrI Credible interval.

