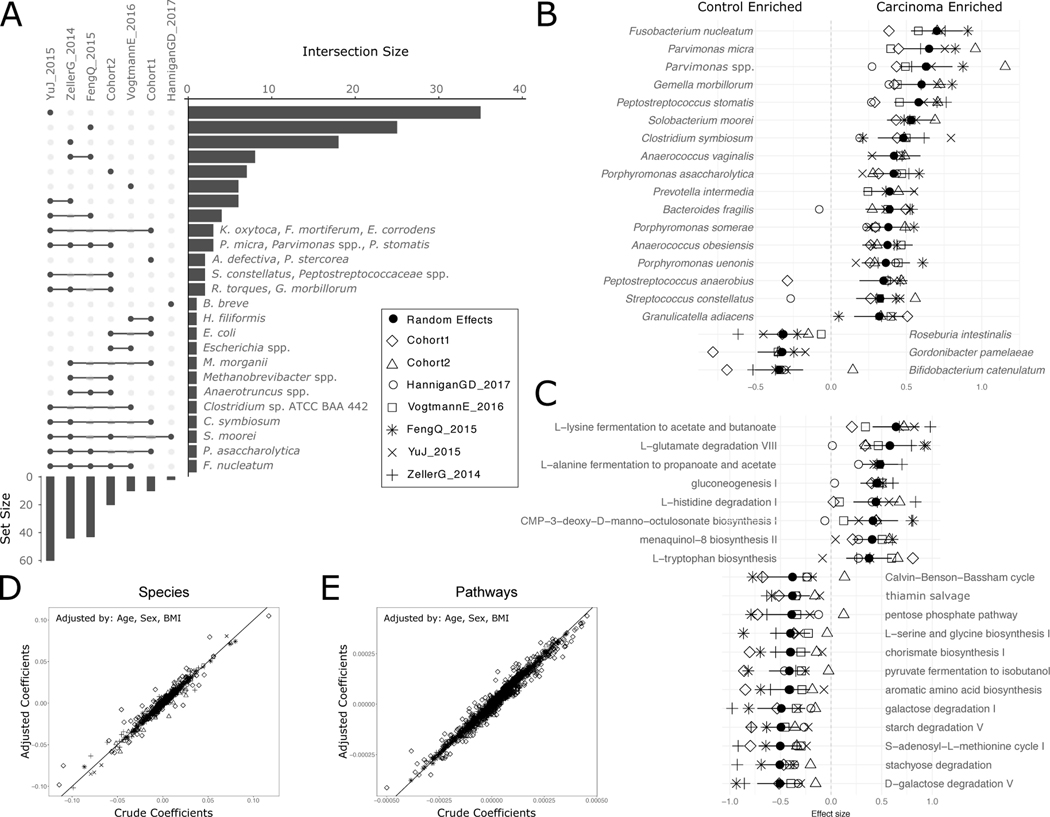
Figure 1. Reproducible taxonomic and functional microbial biomarkers across datasets when contrasting carcinoma against healthy controls (no adenoma samples considered).
(A) UpSet plot showing the number of taxonomic biomarkers identified using LEfSE on MetaPhlAn2 species profiles shared by combinations of datasets (see Suppl. Table 3 for all single significant associations). (B) Pooled effect sizes for the 20 significant features with the largest effect size calculated using a meta-analysis of standardized mean differences and a random effects model on MetaPhlAn2 species abundances and on (C) HUMANn2 pathway abundances. Bold lines represent the 95% confidence interval for the random effects model coefficient estimate. (D) Scatter plot of crude and age-, sex-, and BMI-adjusted coefficients obtained from linear models using MetaPhlAn2 species abundances. (E) Scatter plot of crude and age-, sex-, and BMI-adjusted coefficients obtained from linear models using HUMANn2 pathway abundances.

