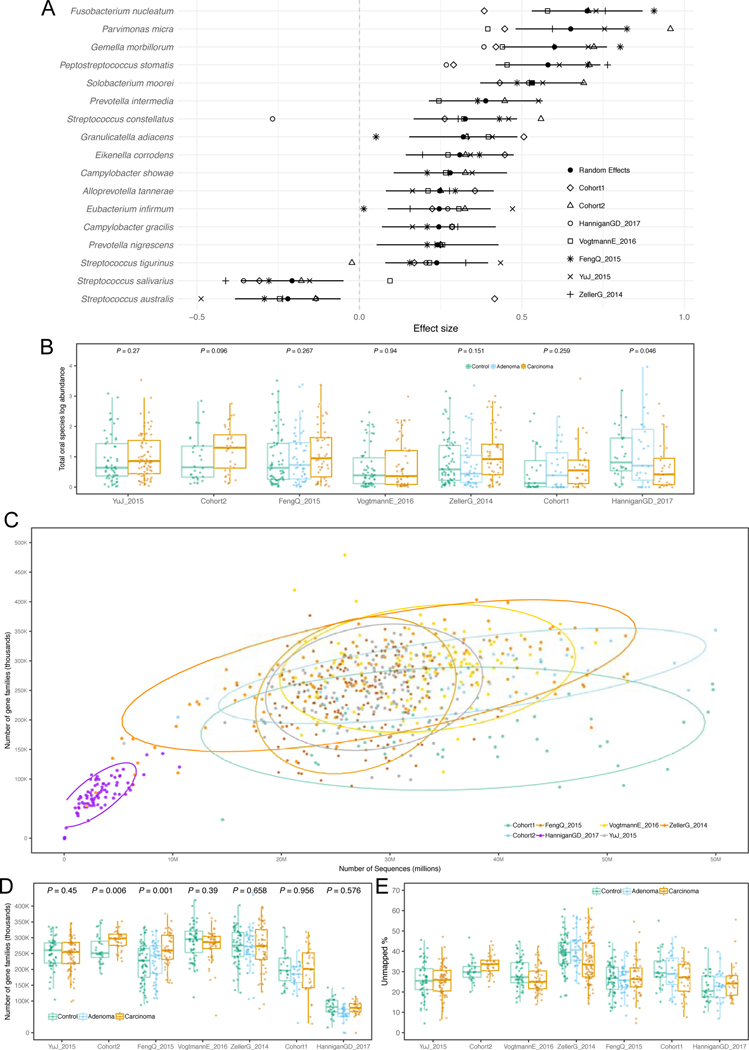
Fig. 5. Analysis of putative oral species’ abundances in CRC datasets and gene families richness across CRC datasets.
(A) Effect sizes of the abundances of significant putative oral species identified using a meta-analysis of standardized mean differences and a random effects model. Bold lines represent the 95% confidence interval for the random effects model estimate. (B) Total abundance of putative oral species in each gut metagenomic dataset. P-values were obtained by two-tailed Wilcoxon rank-sum tests comparing values between controls and carcinomas for each dataset. (C) The total number of reads in each sample of each dataset correlates with the total number of gene families identified using HUMANn2. Ellipses represent the 95% confidence level assuming a multivariate t-distribution. (D) Distribution of the total number of gene families identified in the samples of each dataset. P-values were obtained by two-tailed Wilcoxon rank-sum tests comparing values between controls and carcinomas for each dataset. (E) Distribution of the percentages of unmapped reads across datasets for UniProt90 gene families.

