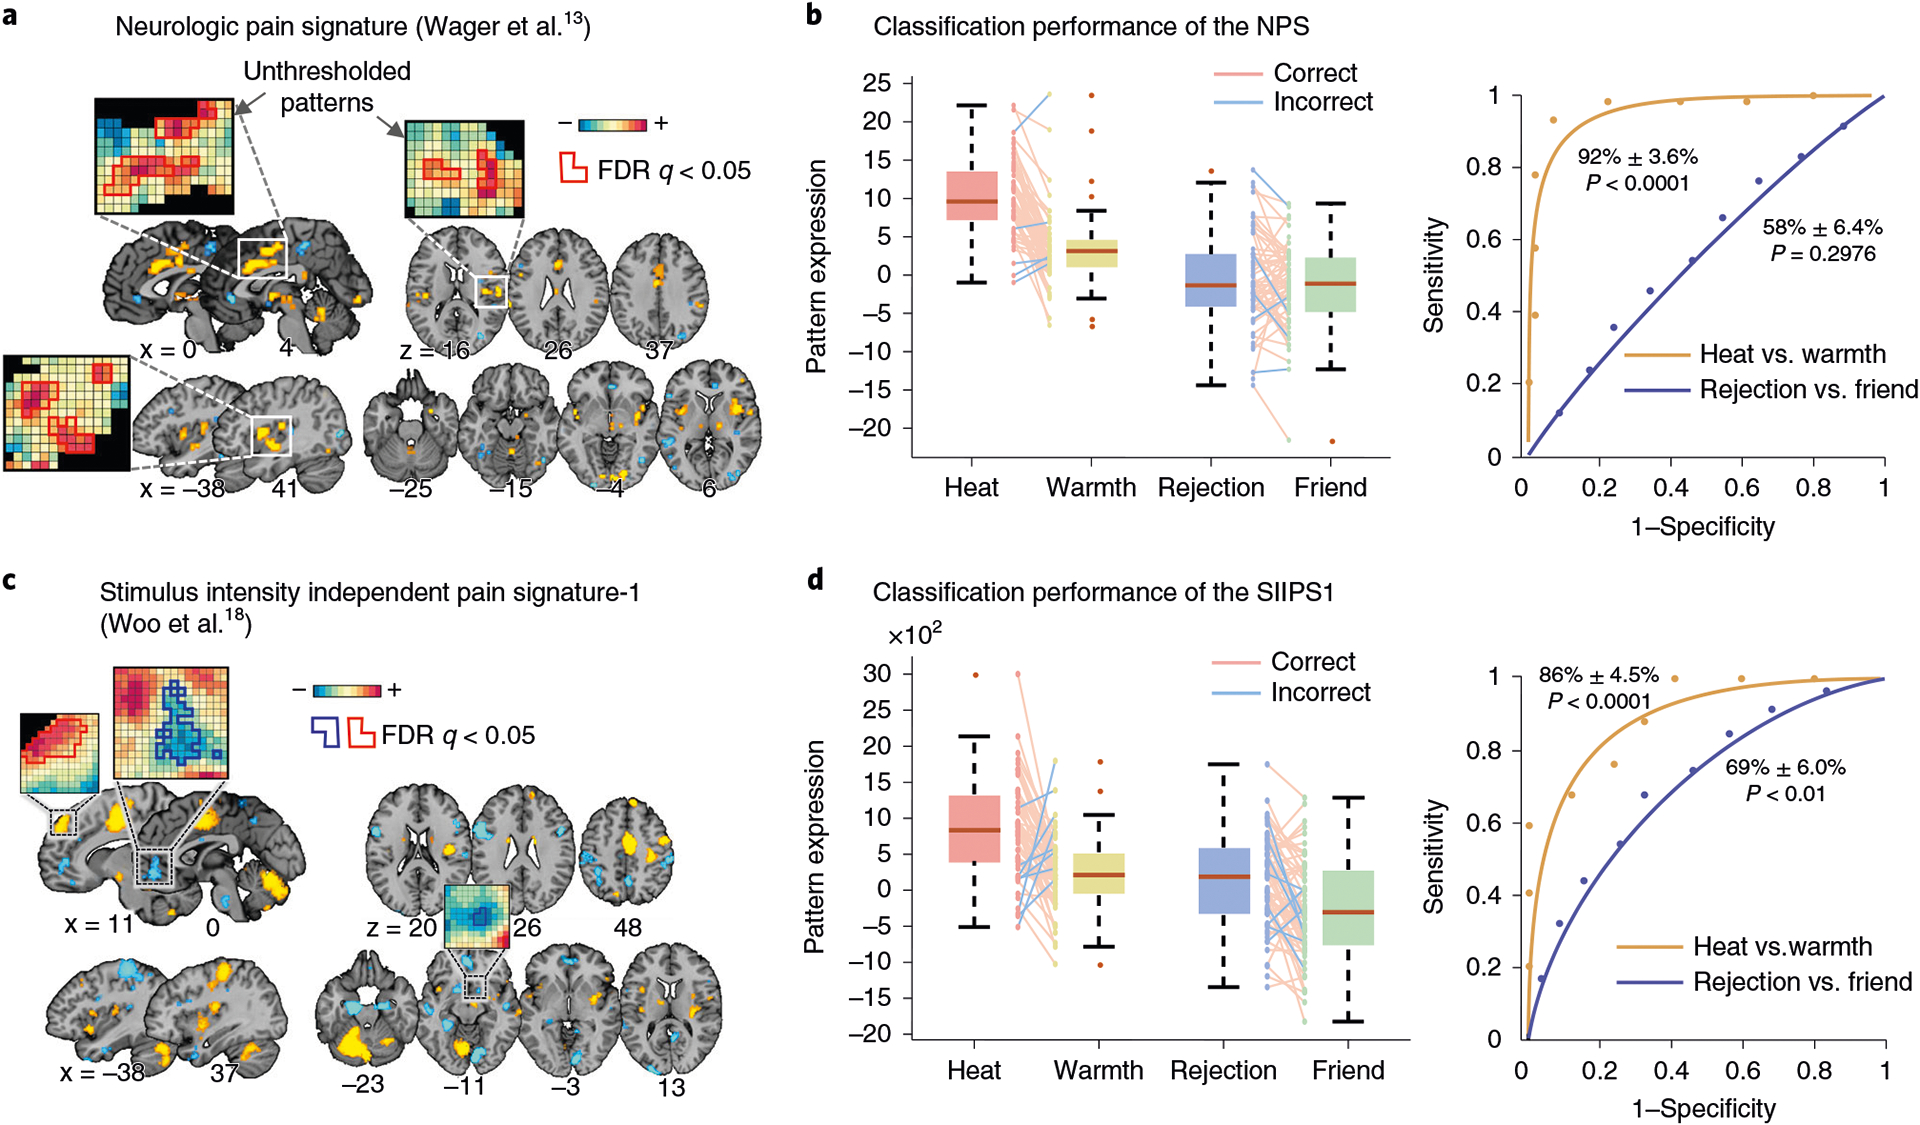
Fig. 6 |. Generalizability tests (Steps 8–10).

a, The predictive weight map of the NPS13 that exceeds an FDR threshold of q < 0.05. b, To assess the generalizability of the NPS (Steps 8–10 of the procedure), we calculated the pattern expression values using the dot product between the signature pattern weights and activation maps for different conditions. Then, we performed the 2AFC test for heat versus warmth and rejection versus friend conditions. The box plot shows the NPS response to the four conditions. The lines between the boxes depict the correct (pink lines) and incorrect (blue lines) classifications. The ROC plot shows the sensitivity and specificity for discriminating between heat and warmth conditions (yellow) and between rejection and friend conditions (blue). c, The predictive weight map of the SIIPS118 that exceed an FDR threshold of q < 0.05. d, The box plot shows the SIIPS1 response to the four conditions. The lines between the boxes depict the correct (pink lines) and incorrect (blue lines) classifications. The ROC plot shows the sensitivity and specificity for discriminating between heat and warmth conditions (yellow) and between rejection and friend conditions (blue).
