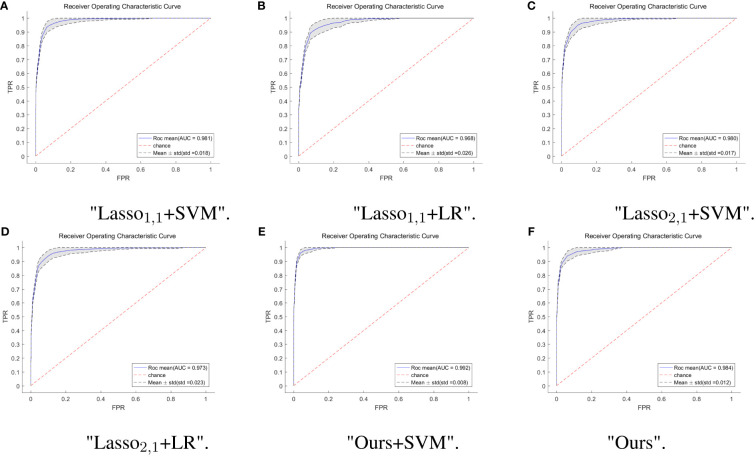
Figure 4.
ROC curves of multi-task model in six. The horizontal coordinate indicates the false positive rate and the vertical coordinate indicates the true positive rate. (A) ROC curves for the Lasso1,1+SVM model, the blue solid line indicates the average ROC curve and the black dashed line indicates the mean ± std. (B) ROC curves for the Lasso1,1+LR model, the blue solid line indicates the average ROC curve and the black dashed line indicates the mean ± std. (C) ROC curves for the Lasso2,1+SVM model, the blue solid line indicates the average ROC curve and the black dashed line indicates the mean ± std. (D) ROC curves for the Lasso2,1+LR model, the blue solid line indicates the average ROC curve and the black dashed line indicates the mean ± std. (E) ROC curves for the Ours+SVM model, the blue solid line indicates the average ROC curve and the black dashed line indicates the mean ± std. (F) ROC curves for the Ours model, the blue solid line indicates the average ROC curve and the black dashed line indicates the mean ± std.

