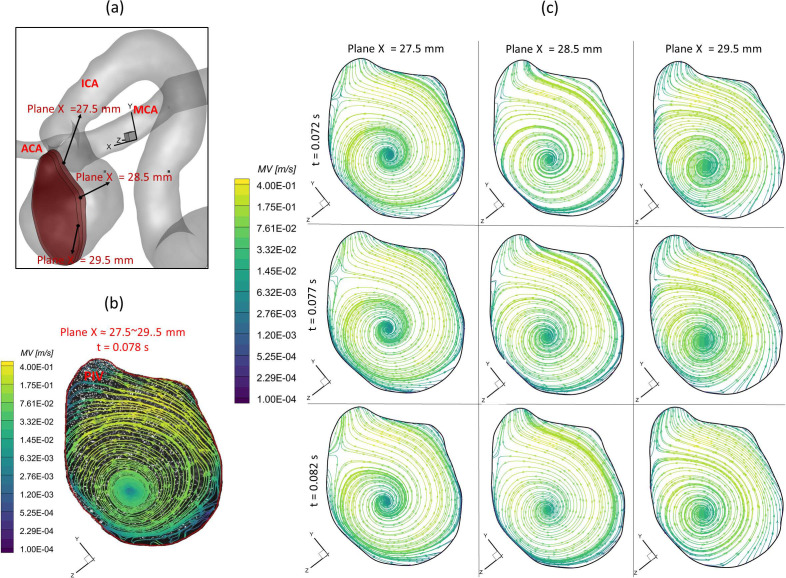
FIG. 8.
Comparisons of flow streamlines and magnitudes of velocity at the extracted slice B (plane x ≈ 27.5–29.5 mm) between PIV measurements and CFD simulations at the time instant t = 0.078 s: (a) schematic planes for the comparisons between PIV and CFD. (b) Distributions of flow streamlines and magnitudes of velocity in PIV. (c) Distributions of flow streamlines and magnitudes of velocity in CFD.

