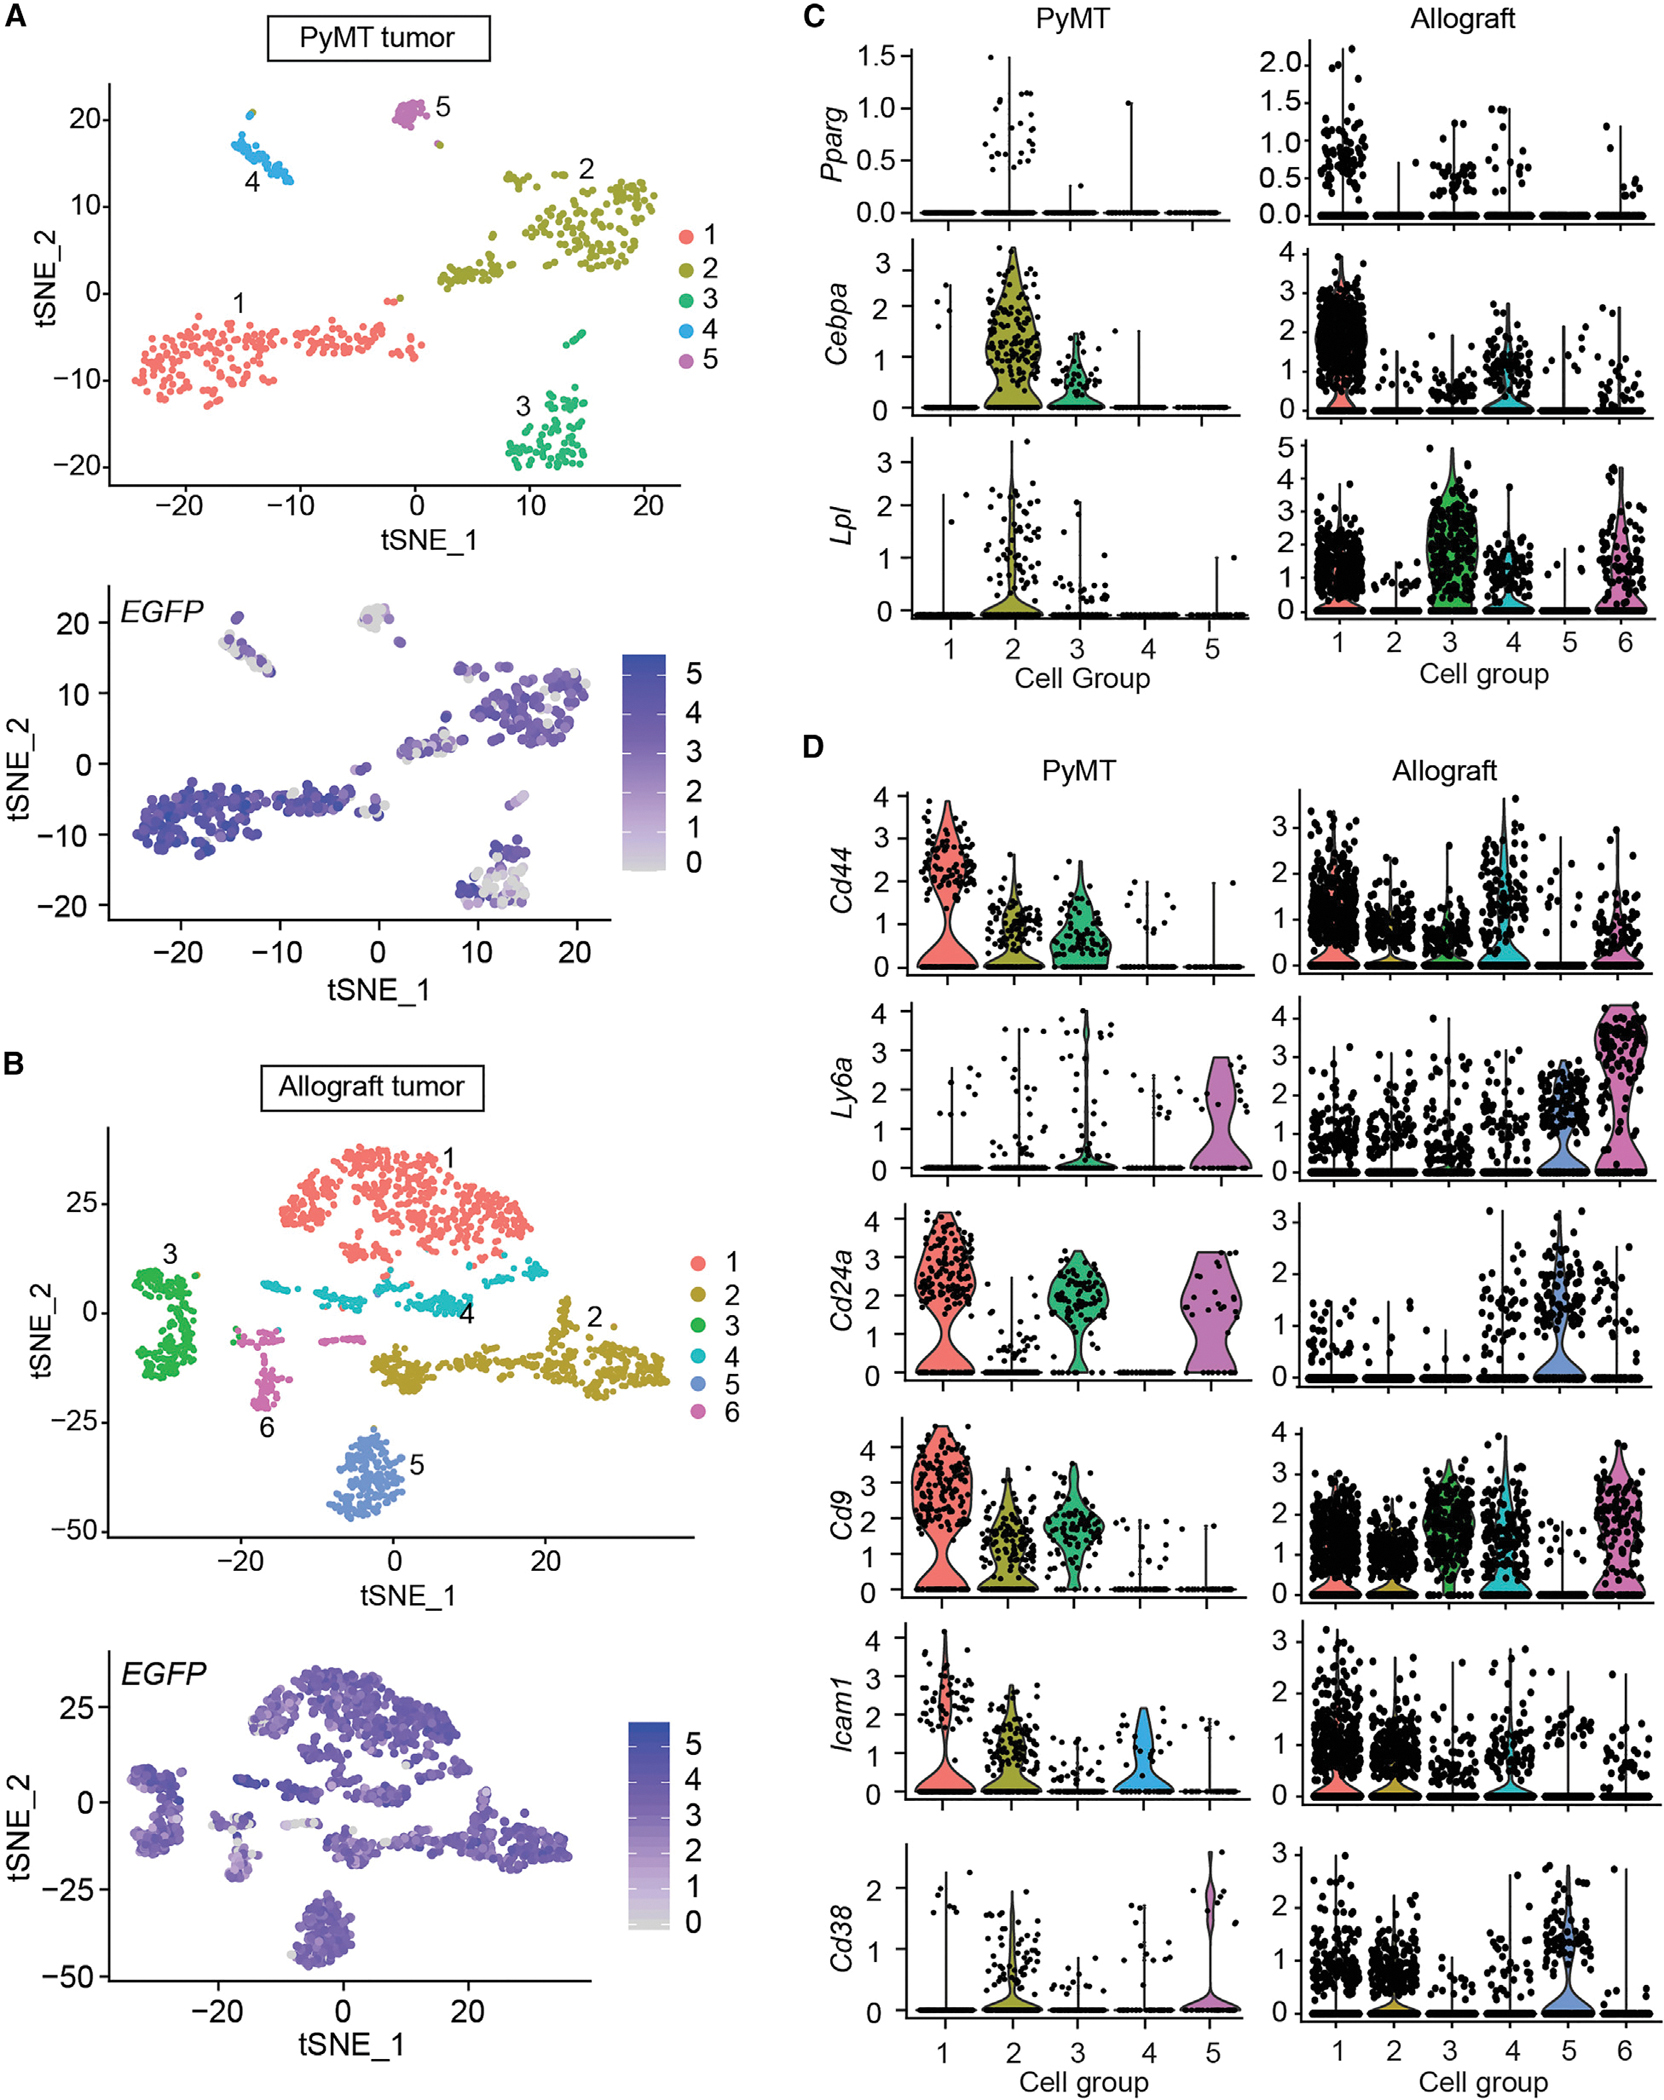
Figure 2. Single cell-RNA sequencing reveals adipocyte mesenchymal transition during mammary tumor progression.

EGFP-labeled de-differentiated adipocytes from PyMTChaser and AlloChaser mice were isolated by FACS and subjected to scRNA-seq.
(A and B) T-distributed stochastic neighbor embedding (t-SNE) plots. Clustering of PyMT-EGFP + or allograft (Allo)-EGFP + cells, with mean number of genes per cell equals 1, 163 or 2, 173, respectively.
(C) Representative adipocyte early differentiation marker genes.
(D) Representative mesenchymal stem cell/adipocyte precursor marker genes. The y axis is the log-scale normalized read count.
