
Figure 4. Distinct metabolic characteristics of tumor-induced de-differentiated adipocytes.
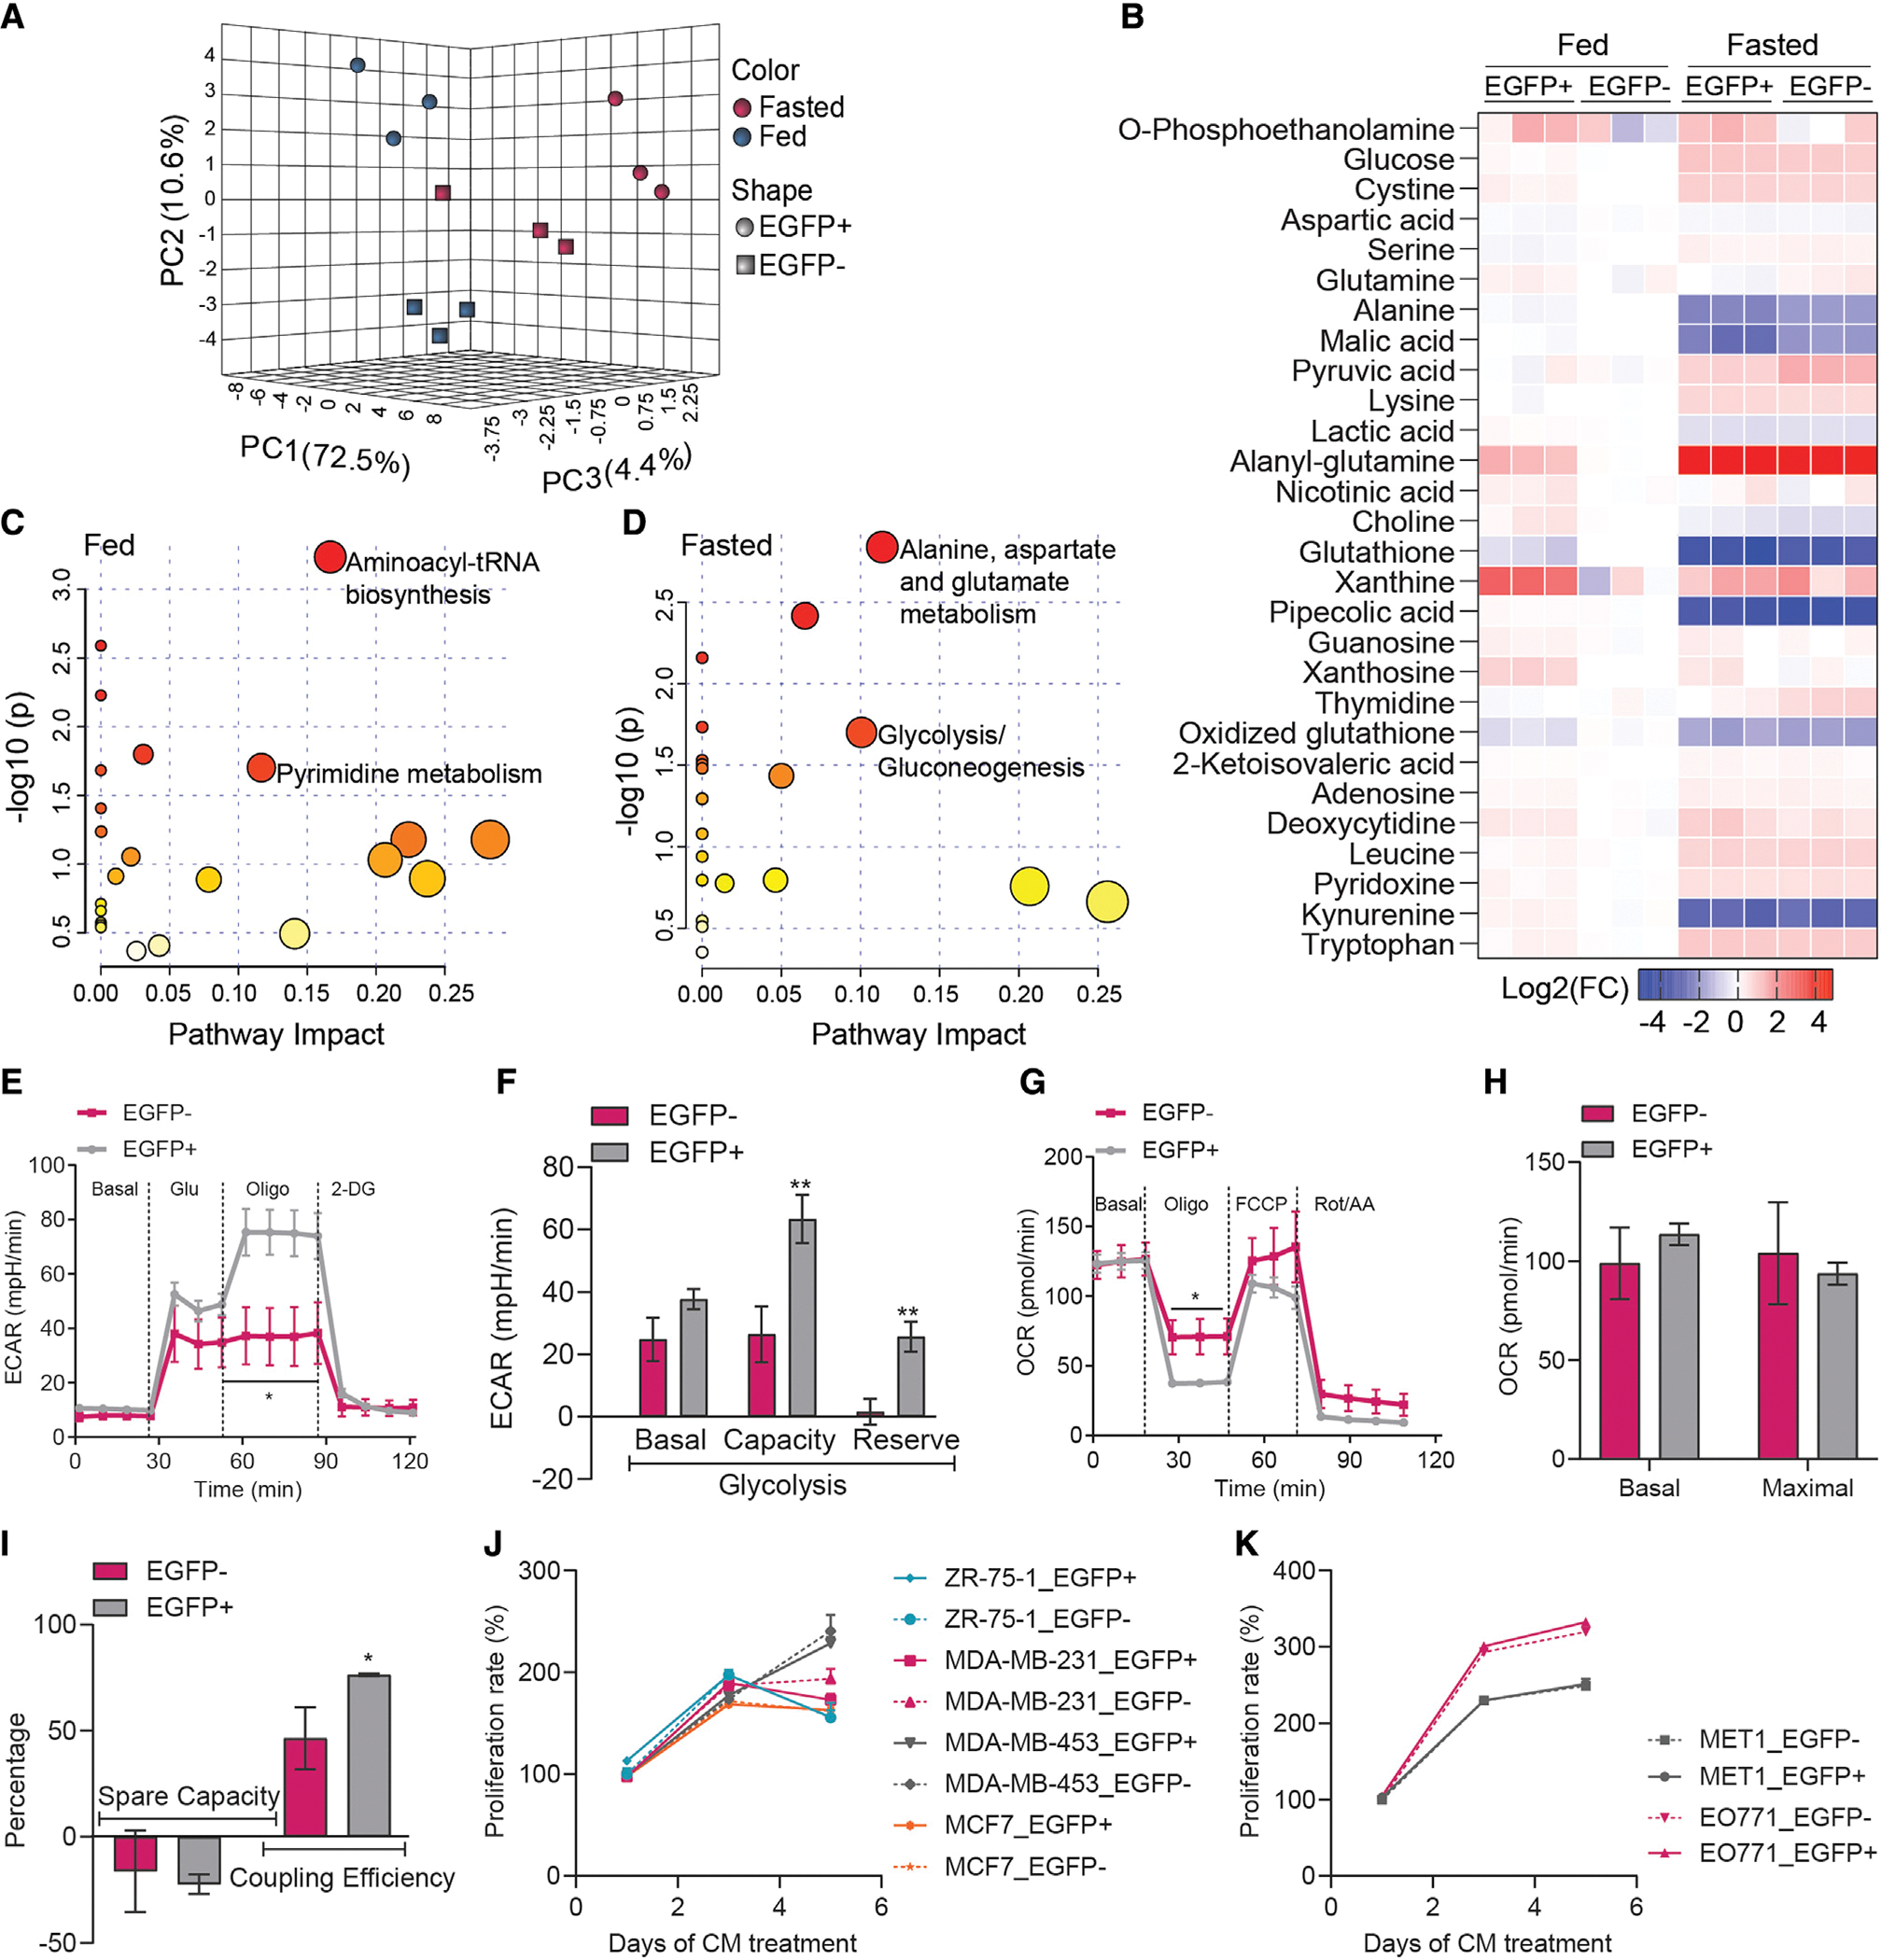
(A and B) Interactive PCA analysis and heatmap of metabolite profile in the culture medium of de-differentiated adipocytes (EGFP+, tdTomato−) and tumor-associated fibroblasts (EGFP−, tdTomato+) isolated from AlloChaser-tumor (n = 3). At fasted condition, medium was analyzed in the absence of serum for 6 hr.
(C and D) The metabolome map of matched metabolic pathways in fed and fasted condition according to the p values from the enrichment analysis and impact values from the pathway topology analysis. Colors varying from yellow to red indicate the metabolites are in enrichment analysis with different levels of significance.
(E and F) Enhance glycolysis in EGFP + cells (n = 6–7).
(G–I) EGFP + cells exhibit similar basal and maximal oxygen consumption rate (OCR) but have higher coupling efficiency (n = 6–7). Conditioned medium (CM) from EGFP + cells and EGFP− cells shows similar effects on the proliferation of various human (J) and mouse (K) breast cancer cells (n = 4). Data are presented as mean ± SEM. Unpaired Student’s t test was used in (E)-(I); two-way ANOVA with Holm-Sidak’s multiple comparisons test was used in (J) and (K). *p < 0.05; **p < 0.01.