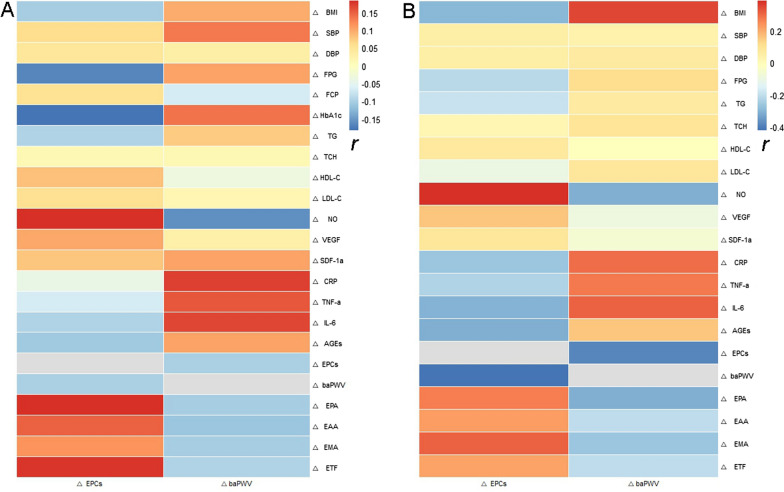
Fig. 5.
Pearson correlation analysis of the correlation between changes in EPCs and baPWV (ΔEPCs and baPWV) and changes in other clinical parameters (r). a MET group; b MET-DUL group. BMI body mass index, SBP systolic pressure, DBP diastolic pressure, FPG fasting plasma glucose, FCP fasting C peptide, HbA1c, glycated haemoglobin A1c, TG triglyceride, TCH total cholesterol, HDL-C high density lipoprotein cholesterol, LDL-C low density lipoprotein cholesterol, NO nitric oxide, VEGF vascular endothelial growth factor, SDF-1α stromal cell derived factor-1α, CRP C-reactive protein; TNF-α tumour necrosis factor-α, IL-6 interleukin-6, AGEs advanced glycation end products, EPCs endothelial progenitor cells, baPWV brachial–ankle pulse wave velocity, EPA proliferative ability of endothelial progenitor cells, EAA adhesion ability of endothelial progenitor cells, EMA migration ability of endothelial progenitor cells, ETF tubule forming ability of endothelial progenitor cells; ∆ the change value of various index before and after treatment; r correlation coefficient

