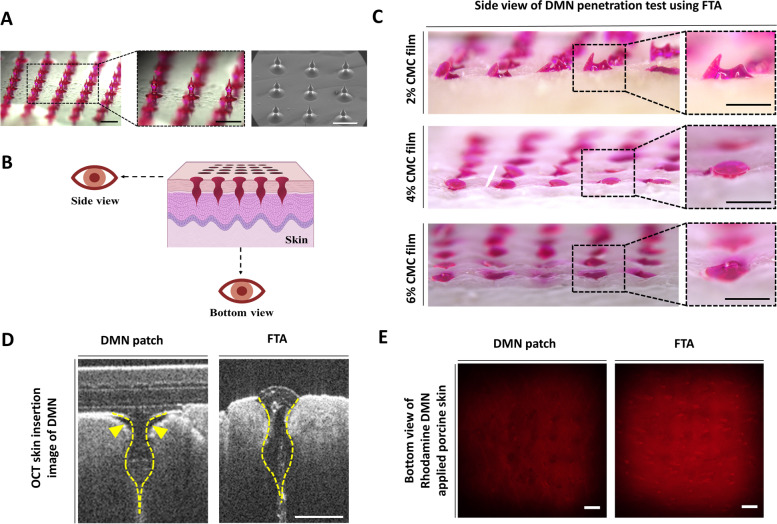
Fig. 4.
DMN penetration analysis and rhodamine B model drug diffusion test using FTA system in vitro. a Optical microscope and SEM images of DMN arrays fabricated on the film (Scale bar, 1 mm). b View-point instruction of DMN application using FTA. c DMN application efficiency of FTA system at different concentrations of CMC films (Scale bar, 500 µm). d OCT images of DMN patch and FTA system. Dashed line indicates the shape of DMN inserted in the skin. Arrowhead indicates cavity formed after DMN patch application (Scale bar, 500 µm). e The bottom view of fluorescence diffusion of rhodamine B-loaded DMN applied to the porcine skin at 12 h after penetration (Scale bar, 1 mm)

