Fig. 2.
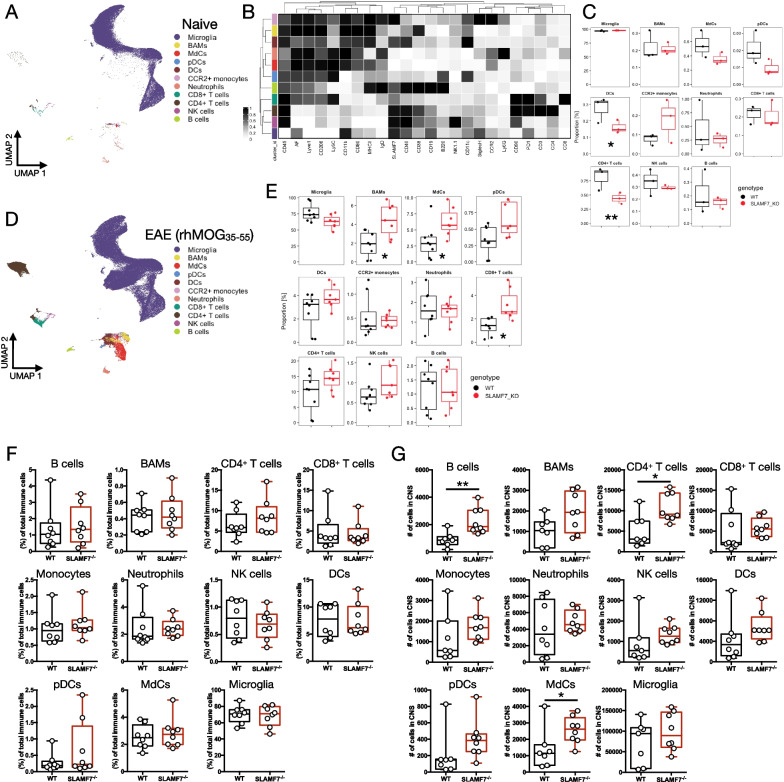
Single-cell deep CNS immune profiling of WT and SLAMF7−/− mice across multiple EAE models. A UMAP of all CNS immune cells in the CNS of WT (n = 3) and SLAMF7−/− (n = 3) mice at steady state profiled with high-dimensional single-cell spectral cytometry. B Heatmap of marker expression across immune cell subsets from A. C Comparison of frequencies of immune cell subsets from WT and SLAMF7−/− mice at steady state. D UMAP of all CNS immune cells in the CNS of WT (n = 8) and SLAMF7−/− (n = 7) mice during peak EAE induced with rhMOG35–55 profiled similarly to mice from A–C. E Comparison of frequencies of immune cell subsets from WT and SLAMF7−/− mice in D. F Frequency of various CNS immune cell subsets between WT (n = 8) and SLAMF7−/− mice (n = 8) during EAE induced with rmMOG1–125. G Total number of various immune cell subsets in the CNS of WT (n = 8) and SLAMF7−/− mice (n = 8) during EAE induced with rmMOG1–125. Groups in C, E compared using a GLMM and representative of a single experiment. Groups in F, G compared using unpaired two-way t-tests and representative of two independent experiments showing similar results. *p < 0.05, **p < 0.01. BAMS, border-associated macrophages; MdCs, myeloid-derived cells

