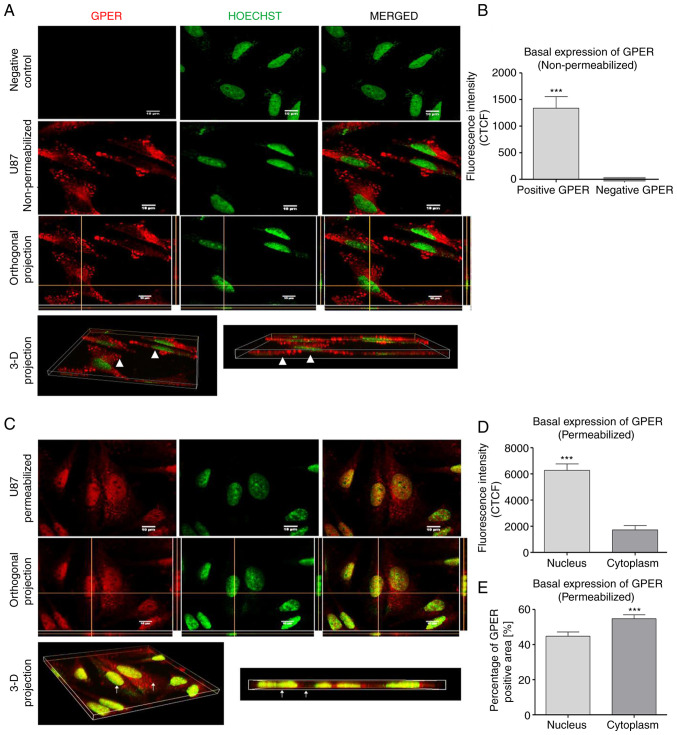
Figure 2.
Subcellular localization of GPER in non-permeabilized and permeabilized U87 cells. (A) In non-permeabilized cells, GPER aggregates (red) were mainly observed at the edge of the cell and on the rest of the cell surface. In the merged image, there was no presence of GPER in the nucleus (green); likewise, in the orthogonal projection, in which the intersections of the yellow lines corresponded to the point in the XZ, YZ. plane, which confirmed that in the position of the nucleus there was no presence of GPER (white arrows indicate the nucleus or cytoplasm). (B) Total CTCF analysis of the positive and negative GPER areas in the analyzed images. (C) GPER aggregates (red) were observed in the nucleus and cytoplasm of permeabilized cells (white arrows indicate the nucleus or cytoplasm). (D) CTFC analysis demonstrated a higher fluorescence intensity of GPER was the nucleus than in the cytoplasm. (E) Analysis of the subcellular distribution of the GPER-positive area indicated a lower distribution percentage in the nucleus than in the cytoplasm. Scale bar, 10 µM. Results are expressed as the mean ± SEM, n=3 (***P<0.001 vs. negative GPER or cytoplasm). GPER, G-protein coupled estrogen receptor; CTCF, corrected total cell fluorescence.

