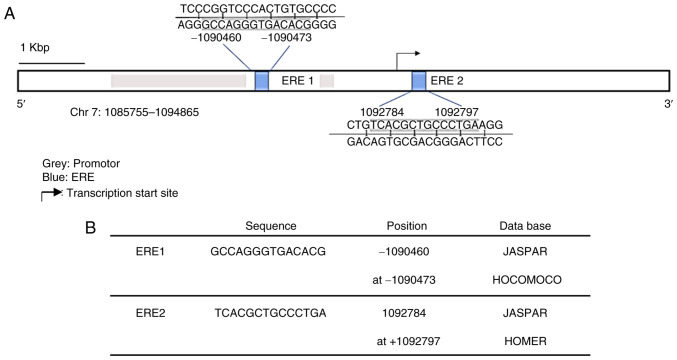
Figure 3.
Prediction of EREs in the GPER gene. (A) Schematic representation of the GPER gene. The ERES predicted by in silico analysis are marked in blue, and the promoter regions (1086600-1089001 bp and 1090400-1090601 bp) are marked in gray. The black arrow points to the transcription start site. Scale bar, 1 Kbp (kilobase pair). (B) Sequence and position of the two potential EREs predicted by the two databases are indicated. EREs, estrogen response elements; GPER, G-protein coupled estrogen receptor.

