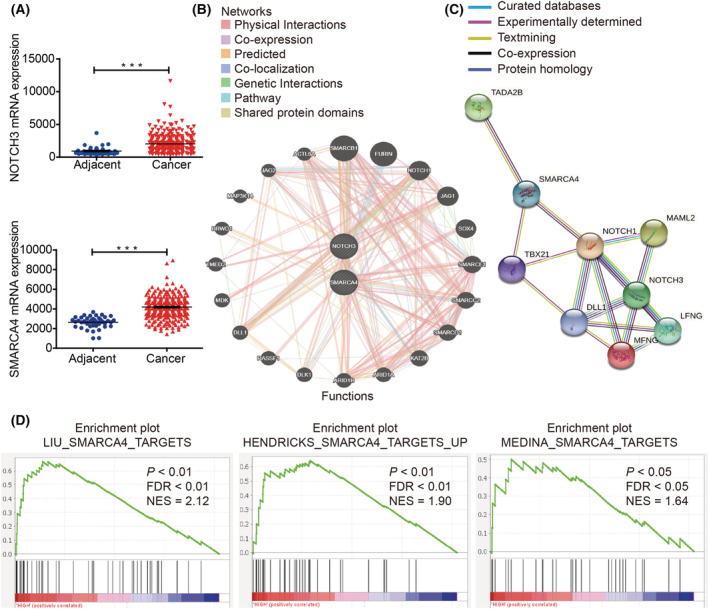
Fig. 1.

A close correlation was noted between NOTCH3 and SMARCA4 in multiple signaling pathways. (A) The expression of NOTCH3 and SMARCA4 in CRC tissues (n = 287) and the adjacent normal tissues (n = 41) based on the TCGA database. (B) The biological network between NOTCH3 and SMARCA4 through GeneMANIA (http://genemania.org/). (C) The biological network between NOTCH3 and SMARCA4 through STRING (https://string‐db.org/). (D) Enrichment plots of GSEA indicate that the gene signatures of SMARCA4 targets were significantly enriched in high NOTCH3‐expressing CRC specimens (n = 382). Data are presented as mean ± SEM; statistical analyses were performed using Student's t tests in A (***P < 0.001); FDR, false discovery rate; NES, normalized enrichment score. [Colour figure can be viewed at wileyonlinelibrary.com]
