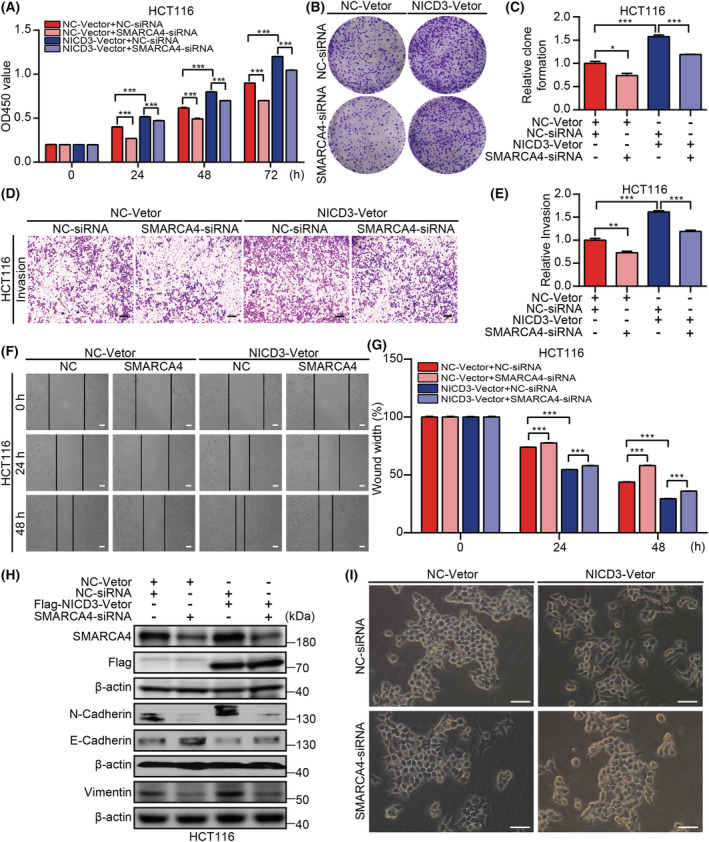
Fig. 5.

NOTCH3 regulates the progression of HCT116 cells in a SMARCA4‐dependent manner. (A) CCK‐8 assay was performed to detect the proliferative activity of HCT116 cells in different groups (n = 3). (B, C) The clone formation assay was used to detect the proliferative activity of HCT116 cells in different groups and related statistical analysis was performed (n = 3). (D, E) Transwell invasion assay was performed to detect the invasion abilities of HCT116 cells in different groups, and the related statistical analysis was performed (scale bar: 400 μm; n = 3). (F, G) The scratch assays were performed to detect the migration abilities of HCT116 cells in different groups, and the related statistical analysis was performed (scale bar: 100 μm; n = 3). (H) Knockdown of SMARCA4 increased the E‐cadherin expression and decreased the N‐cadherin and vimentin expression in NICD3‐overexpressed HCT116 cells (n = 3). (I) Morphological assays were performed to detect the morphological changes of HCT116 cells in different groups (scale bar: 25 μm; n = 5). Data are presented as mean ± SEM. Statistical analyses were performed using unpaired Student's t tests. *P < 0.05, **P < 0.01, ***P < 0.001; NC, negative control; si, short interfering. [Colour figure can be viewed at wileyonlinelibrary.com]
