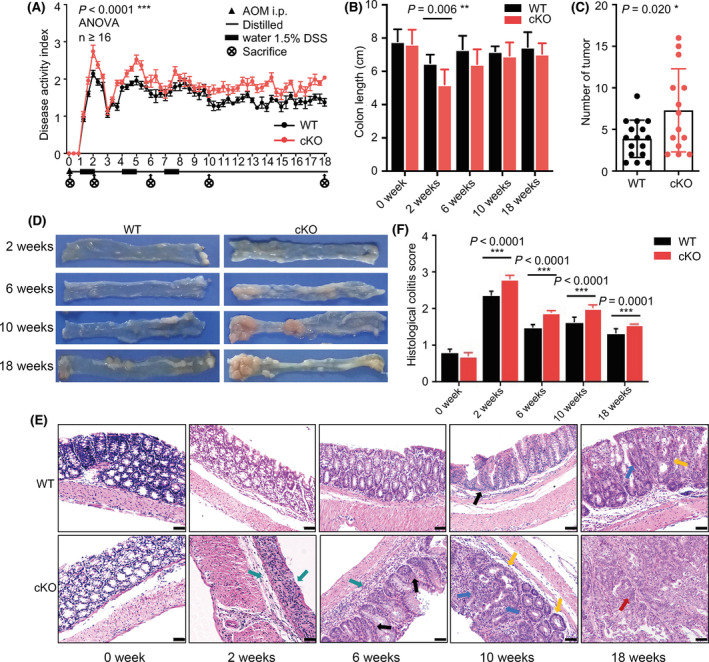
Fig. 2.

miR‐126 deficiency in IECs exacerbated CAC development. (A) Changes in the disease activity index (DAI) during AOM/DSS treatment in the wild‐type (WT) and miR‐126ΔIEC (cKO) groups (WT n = 21, KO n = 16). DAI = (weight loss score + stool characteristic score + haematochezia score)/3. (B) Length of the colon from each group (WT n = 8, KO n = 6). (C) The numbers of tumours were measured at the 18th week of AOM/DSS administration (WT n = 16, KO n = 14). (D) Gross colon morphology at the 2nd, 6th, 10th and 18th weeks of treatment. Colons were opened longitudinally (n = 5). (E, F) Representative images of histological sections (magnification: 200×; scale bar = 50 μm) and histological colitis scores of mice in each group (WT n = 8, KO n = 7). Green arrows indicated inflammatory cells infiltrating in the mucosal and submucosa; black arrows indicated dysplasia crypt; yellow arrows indicated aberrant crypt foci; blue arrows indicated high‐grade intraepithelial neoplasia; red arrows indicated carcinoma polyp. Data are presented as the mean ± SEM (Panel A) or mean ± SD. Statistical analyses were performed using two‐way ANOVA with Geisser–Greenhouse correction for DAI comparison and multiple unpaired t tests for the remaining data (*P < 0.05; **P < 0.01; and ***P < 0.0001).
