
Fig. 6.
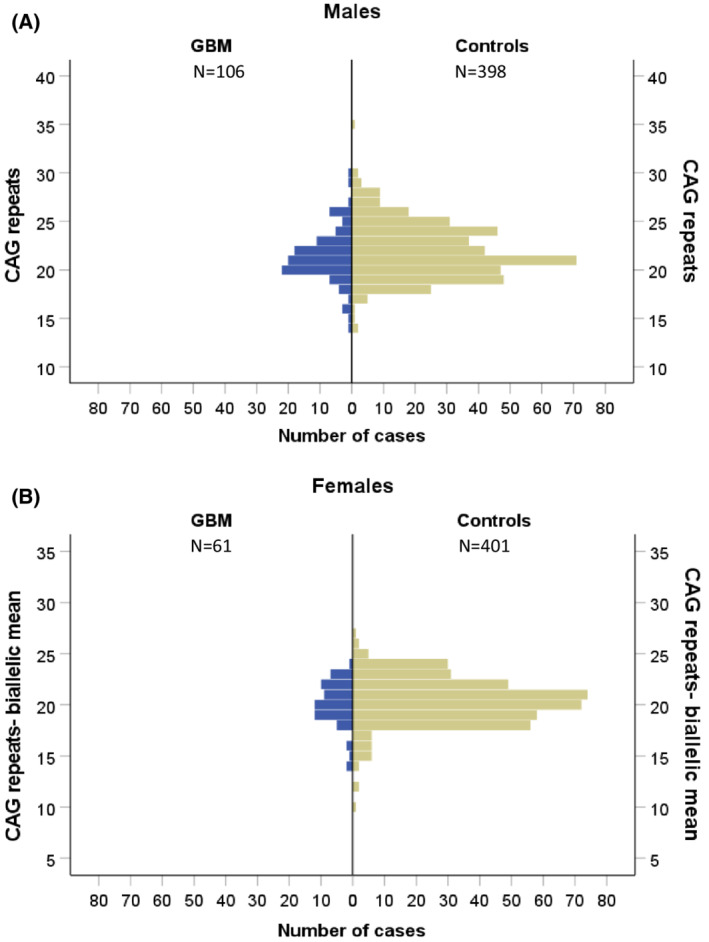
Comparison of the number of CAG repeats in exon 1 of AR in GBM and healthy controls. Results from one allele for males (A), and the CAG biallelic mean values for females (B) showed no distribution differences between the patients (blue) and healthy population (green).