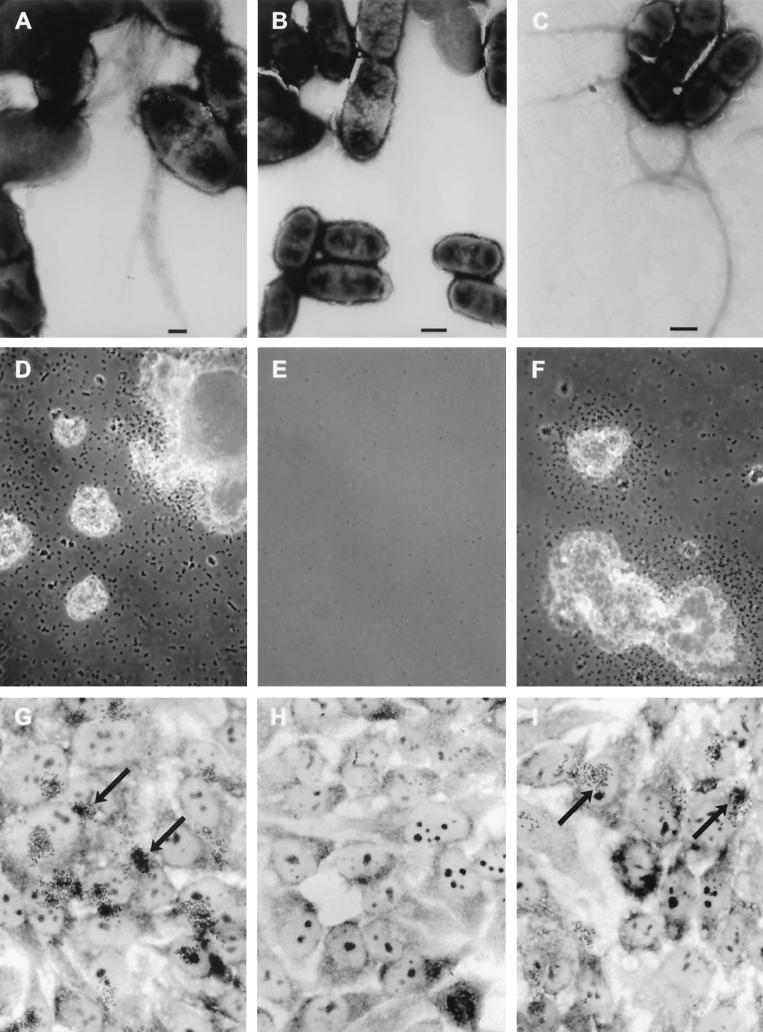
FIG. 1.
Assay of BFP formation, autoaggregation, and localized adherence by EPEC. Shown are the wild-type EPEC strain E2348/69 (A, D, and G) and the isogenic bfpE mutant UMD934 bearing either the vector pTrcphoA (B, E, and H) or plasmid pTEB41 carrying the bfpE gene (C, F, and I). The top row (A to C) displays transmission electron micrographs of EPEC cultured in DMEM for 6 h. Magnifications, ×20,000 (A) and ×12,000 (B and C). Bar, 200 nm (A) or 500 nm (B and C). BFP can be seen in panels A and C. The center row (D to F) displays phase-contrast micrographs (magnifications, approximately ×460 for panels D and F and ×580 for panel E) of EPEC cultured in DMEM for 7 h and then examined in hanging drop slides. EPEC aggregates are seen in panels D and F. The bottom row (G to I) displays phase-contrast micrographs (magnification, ×630) of HEp-2 cells incubated for 3 hours with EPEC, washed, and fixed. Adherent EPEC microcolonies are seen in panels G and I. Arrows point to two of the microcolonies in each panel.

