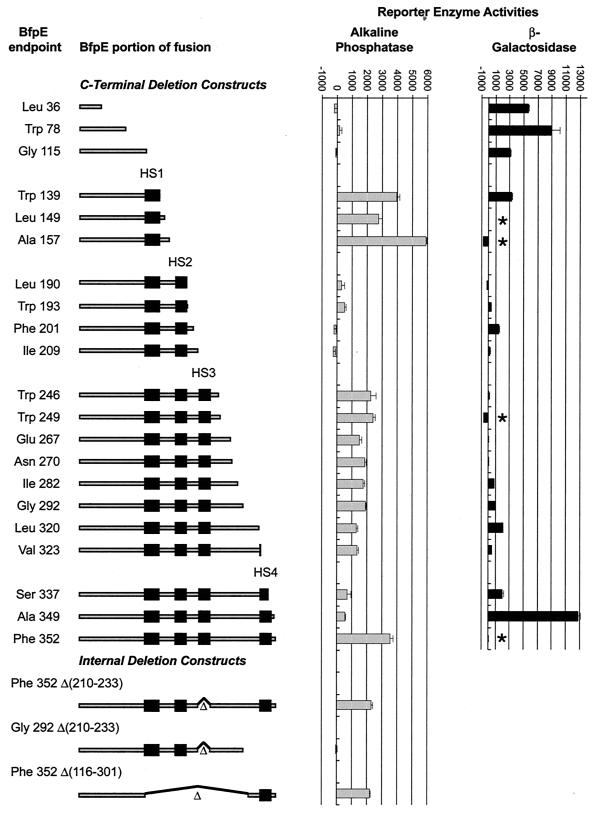
FIG. 4.
Activities of BfpE-LacZ and BfpE-PhoA fusion proteins. In the diagrams to the left, the shaded bars represent the extent of BfpE included in each fusion protein and the black boxes represent potential transmembrane segments. Black lines and triangles indicate deleted portions of BfpE. Alkaline phosphatase or β-galactosidase enzyme assays were performed on permeabilized cultures of E. coli CC118 carrying fusion plasmids. The bar graph data represent the mean and standard error values (in units of enzyme activity) for four enzyme activity determinations from a single set of permeabilized cells per sample. Similar results were obtained in repeated experiments. Each datum point corresponds to the fusion depicted to the left of it. Four points are absent from the LacZ data (indicated by asterisks) because a plasmid expressing the fusion was not constructed (residue 149) or a fusion protein was not detected by immunoblotting (residues 157, 249, and 352).

