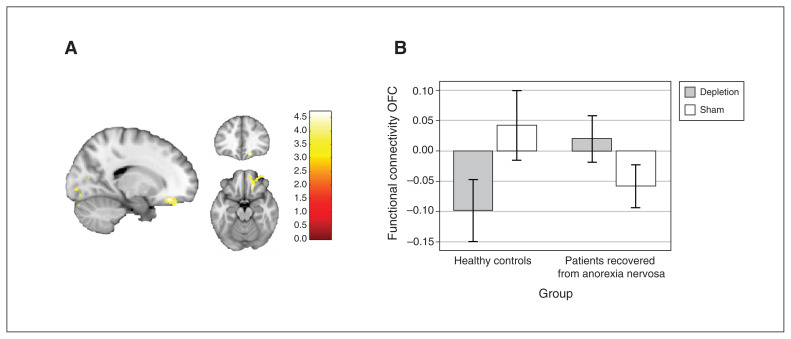
Figure 1.
Group differences in functional connectivity between the right supramarginal gyrus and the right orbitofrontal cortex in the depletion versus sham conditions. (A) Cluster of the group × condition interaction at the orbitofrontal cortex, spreading to the frontal pole; the cluster withstood Bonferroni correction for 7 seed regions (number tested and correlated; r = 0.86). (B) Connectivity values between the seed and the orbitofrontal cortex, by group and condition.

