FIGURE 1.
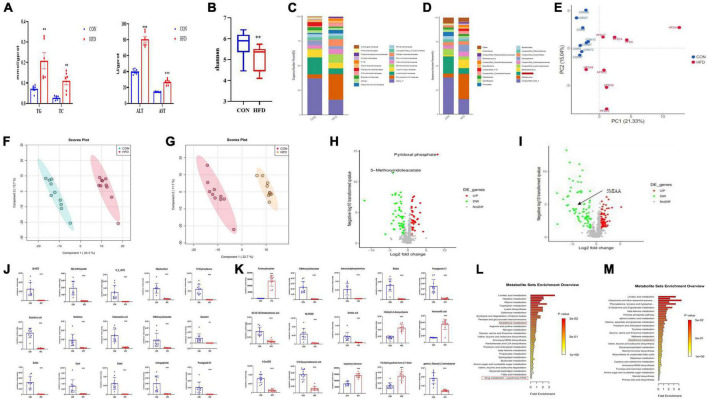
NAFLD induced by HFD with gut microbiome and metabolic disorders, oxidative stress in mice. (A) Hepatic TC, TG, AST, and ALT levels in mice. (B) Box-plot of the Shannon of the CON and HFD groups. (C,D) Analysis of the different relative abundances of the bacterial community at the family and genus levels in CON and HFD mice. (E) PCA score plot analysis based on the relative abundance of OTUs. Different color indicates each group of mice (n = 8), and each spot represented one mouse. (F,G) PLS-DA score plot analysis of metabolites in liver (R2Y = 0.937, Q2 = 0.89) and intestinal contents (R2Y = 0.942 Q2 = 0.879). (H,I) Volcano plot of metabolites enrichment analysis of liver tissue and intestinal contents in the control and model group. (J) The contents of the top 15 altered features identified from metabolites of liver tissue from the experiment described in (H). (K) The contents of the top 15 altered features identified from UPLC-MS/MS analysis in intestinal contents from the experiment described in (I). (L,M) Mummichog pathway analysis of liver tissue and intestinal contents for the identification of pathways induced in the HFD group relative to CON groups. Red boxes highlight pathways involved in antioxidant and xenobiotic metabolism. All the data were presented as the means ± SD from n = 8-10 mice per group. Significant differences compared with the CON group were indicated by asterisks: *P < 0.05, **P < 0.01, and ***P < 0.001.

