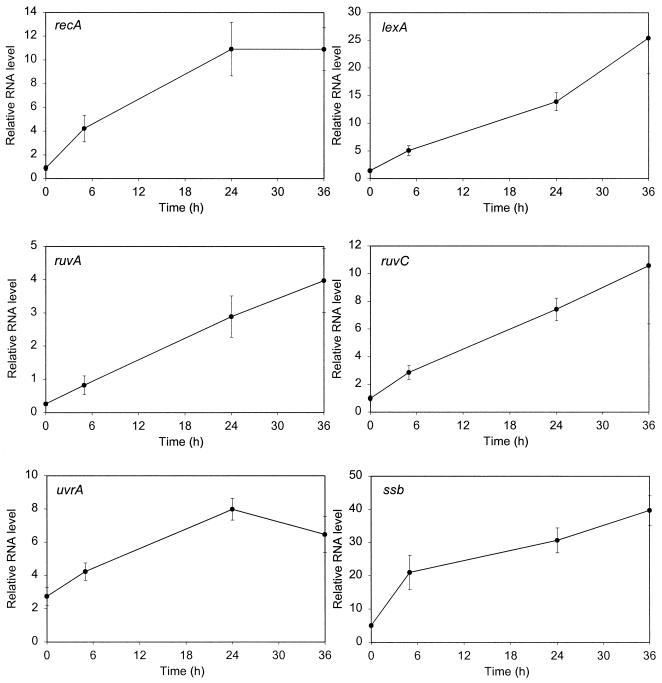
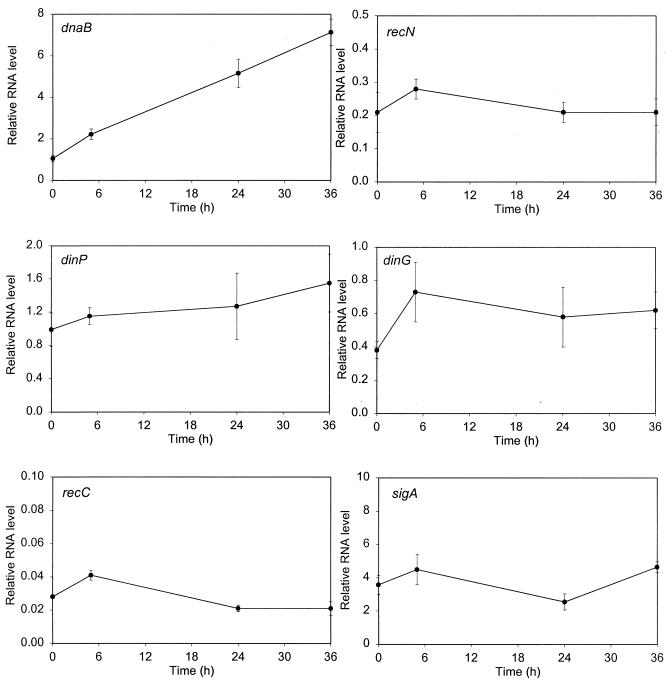
FIG. 1.
Gene expression following DNA damage. The amount of mRNA for each gene relative to that of a normalizing gene (gnd) was determined by real-time quantitative RT-PCR using RNA samples from cultures harvested at various time points following the addition of mitomycin C (0.2 μg ml−1). For each gene, at least two assays using three or four samples were performed on each of two independent inductions. The values shown are the means; the error bars indicate the standard deviations. Note that the scales of the y axes vary according to the expression level of the gene being analyzed.


