

Abstract
Purpose
Two studies were conducted to explore the patterns of positive affect (PA) and negative affect (NA) while considering collectivist cultural specificity (dialecticism) and to examine the associations of affective profiles with psychosocial adjustment.
Methods
We used two Chinese samples, one comprising adults with adverse childhood experiences (N = 488) and one comprising ordinary adolescents (N = 635). The participants completed scales on PA, NA, and psychosocial adjustment, including mental health problems (depressive symptoms, anxiety), personal strengths (self-esteem, gratitude, resilience), and life satisfaction.
Results
Three profiles were identified through latent profile analysis: well-adjusted (high PA, low NA), low affective (low PA, low NA), and moderate affective (moderate PA, moderate NA). Participants in the well-adjusted profile had the fewest mental health problems (depressive symptoms, anxiety) and scored highest on personal strengths (self-esteem, gratitude, resilience) and life satisfaction. Participants in the low affective profile had fewer mental health problems than those in the moderate affective profile.
Conclusion
Individual differences and cultural variations should be considered when exploring affective profiles. Future interventions aimed at promoting affective well-being should accommodate dialecticism and individual differences in the target population.
Supplementary Information
The online version contains supplementary material available at 10.1007/s10902-022-00566-7.
Keywords: affective profiles, emotion typology, dialecticism, psychosocial adjustment, person-centered approach
Introduction
As an essential indicator of individual well-being (Diener et al., 2003), affective well-being (e.g., happiness, positive emotions, and hedonic well-being) has received much attention not only among the general population but also among vulnerable populations, including adolescents and adults with adverse childhood experiences (ACEs) (Chen et al., 2017; Lennarz et al., 2018; Offer, 2013). To better understand individual differences in affective well-being, an increasing number of studies over the recent two decades have investigated affective profiles as combinations of positive affect (PA) (e.g., proud, excited, and enthusiastic) and negative affect (NA) (e.g., upset, distressed, and guilty), which are two well-accepted dimensions of affective well-being (Ciarrochi & Heaven, 2007; Diener et al., 2003; Fernández-Berrocal et al., 2017).
Research on affective well-being has suggested that individuals have distinctive experiences of PA and NA (Garcia et al., 2014; Miyamoto & Ryff, 2011; Norlander et al., 2002). Norlander and colleagues (2002) proposed four affective temperaments in their affective temperaments model: self-actualizing (high PA, low NA), low affective (low PA, low NA), high affective (high PA, high NA), and self-destructive (low PA, high NA). Empirical support for these four profiles has been found across different populations (e.g., U.S. residents, university students, adolescents, caregivers of dementia patients, and fibromyalgia patients) (Di Fabio & Bucci, 2015; Hassett et al., 2008; MacDonald & Kormi-Nouri, 2013; Robertson et al., 2007; Sanmartín et al., 2020). Moreover, it has been found that self-actualizing people are more likely to have better psychosocial adjustment (e.g., higher life satisfaction, higher self-esteem, lower depressive symptoms, and lower social anxiety) and that self-destructive individuals usually report the poorest psychosocial adjustment (Di Fabio & Bucci, 2015; Garcia et al., 2016; Sanmartín et al., 2020; Schütz et al., 2013). However, the majority of these studies have explored affective profiles in Western contexts and examined profile differences on outcomes with a cross-sectional design. Furthermore, they have not given consideration to the personal strengths, such as resilience and gratitude, that are highly emphasized in positive psychology as important aspects of psychosocial adjustment. In the present two studies, we explored affective profiles in two samples (one of emerging adults with ACEs and one of ordinary adolescents) in the Chinese context and investigated the relationship between affective profiles and psychosocial adjustment (including personal strengths) with a longitudinal design.
Affective Profiles and Cultural Specificity
People in collectivistic cultures may have particular affective profiles because of specific emotional experiences that differ from those of people in individualistic cultures. People living in individualistic cultures tend to have an either/or attitude toward contradictions and see them as problems that need to be resolved. In relation to their own emotions, they tend to resolve contradictions by focusing on positive views toward themselves. Thus, they tend to maximize positive emotions and minimize negative emotions (engaging in so-called hedonic emotion regulation) and are less likely to tolerate the co-existence of positive and negative emotions (Miyamoto & Ryff, 2011; Sims et al., 2015). In contrast, influenced by dialectical thinking, people in collectivistic cultures tend to believe that two contradictory elements (including emotions) are mutually related and can transform into each other (Miyamoto et al., 2014; Shiota et al., 2010). Therefore, they feel more comfortable acknowledging the simultaneous presence of both positive and negative experiences and emotions (Peng & Nisbett, 1999; Wu et al., 2020).
Based on the frequency of positive and negative emotions, Miyamoto & Ryff (2011) proposed an emotion typology categorizing emotional patterns into three dialectical types (maintaining a low, moderate, or high level of positive and negative emotions) and two non-dialectical types (experiencing a discrepancy in positive and negative emotions, such as mostly positive or mostly negative). The presence of these dialectical and non-dialectical emotional patterns have been confirmed in prior studies, and some research has shown that East Asians (e.g., Japanese) and Asian-Americans are more likely to have a dialectical emotional style (especially moderate dialectical emotions) than European-Americans (Miyamoto & Ryff, 2011; Shiota et al., 2010).
The number of affective profiles identified in various populations may differ due to cultural specificities and other characteristics. Although studies have revealed four or five affective profiles supported by different theories/perspectives (e.g., the affective temperaments model and the dialectical perspective) (Di Fabio & Bucci, 2015; MacDonald & Kormi-Nouri, 2013; Miyamoto & Ryff, 2011; Shiota et al., 2010), most of these were conducted in a Western context and not all of the identified profiles have been found in collectivistic cultures. For instance, Ganotice and colleagues (2016) found three profiles of mostly positive affect (high PA, low NA), mostly negative affect (low PA, high NA), and moderate affect among secondary students in the Philippines. Another recent study identified three affective profiles—positive (high PA and low NA), ambivalent (moderate PA and moderate NA), and common (low PA and low NA)—among Chinese teachers in higher education institutions during the Covid-19 pandemic (Zou et al., 2021). However, there is a scarcity of studies on affective profiles in Chinese cultures, and given that dialecticism is one of the most influential philosophical teachings in the Chinese context, more work is especially needed to identify dialectical affective profiles among this population.
In addition to cultural specificity, other characteristics of the study population may also influence affective profiles. People with ACEs (e.g., parental illness, childhood abuse, and peer victimization) usually face greater emotional distress than the general population and their emotional capabilities are potentially damaged by their experiences (Chi & Li, 2013; Cloitre et al., 2019; Jiang et al., 2018). Indeed, ACEs have been found to negatively affect physical health and mental health through impaired emotion regulation (Cloitre et al., 2019; Jiang et al., 2018). Although research on the affective profiles of people with ACEs is rare, it can be anticipated from the available evidence that their affective profiles will differ from those of people without ACEs. Thus, the typology of affective profiles in the vulnerable population of people with ACEs may differ from that of the general population. Furthermore, regarding the distribution of various profiles across the population, people with ACEs may be more likely to be assigned to the profile with low PA and high NA. To explore population differences and cultural specificity in affective profiles, it is necessary to explore the typology of affective profiles among different populations (e.g., the general population and vulnerable populations) in a collectivistic culture.
Affective Profiles and Psychosocial Adjustment
Studies have examined the relationship between affective profiles and psychosocial adjustment (e.g., mental health problems, well-being, behavioral problems, and clinical disorders) in community and clinical samples (e.g., high school students, general U.S. residents, caregivers of dementia patients, and fibromyalgia patients) (Di Fabio & Bucci, 2015; Hassett et al., 2008; Robertson et al., 2007; Schütz et al., 2013). Mental health problems, life satisfaction, and self-esteem are commonly used indicators for general functioning and adjustment in daily life. It has been found that people with high PA and low NA are more likely to report higher life satisfaction and self-esteem and less likely to have mental health problems (e.g., depressive symptoms and social anxiety) (Di Fabio & Bucci, 2015; Garcia et al., 2016; Sanmartín et al., 2020; Schütz et al., 2013). In contrast, individuals with low PA and high NA usually report the lowest life satisfaction and self-esteem and the most mental health problems among all affective profiles (Di Fabio & Bucci, 2015; Garcia et al., 2016; Rapp Ricciardi et al., 2014; Sanmartín et al., 2020; Schütz et al., 2013). However, most of these studies have investigated the relationship between affective profiles and psychosocial adjustment with a cross-sectional design (Di Fabio & Bucci, 2015; Garcia et al., 2016; Sanmartín et al., 2020; Schütz et al., 2013), and have thus been unable to examine the long-term association between affective profiles and developmental outcomes. Longitudinal studies are necessary to examine the relationship between affective profiles and later psychosocial adjustment.
Moreover, the indicators of psychosocial adjustment in previous studies have not included personal strengths, such as resilience and gratitude, which have been conceptualized as a protective mechanism (resilience) against the negative consequences of trauma and as an adaptive mechanism (gratitude) that facilitates positive outcomes following trauma (Vieselmeyer et al., 2017). Resilience is an important form of psychological capital that helps individuals bounce back from various life adversities (Luthans et al., 2007) and gratitude is a prosocial tendency to appreciate others for their benevolence in helping to produce positive outcomes (McCullough et al., 2002). Resilience and gratitude have been found to be positively asscoiated with PA and negatively associated with NA (Dey et al., 2021; Sun & Kong, 2013). Recently, resilience and gratitude have been treated as important outcomes by studies examining profile differences of psychological and behavioral processes (e.g., support and the virtue of thrift) (Puckett et al., 2019; Ratchford et al., 2020), but few studies have examined the affective profile differences in these personal strengths. Because personal strengths are emphasized in positive psychology and are vital for psychosocial adjustment (Shoshani & Aviv, 2012), we aim to examine affective profile differences on psychosocial adjustment while considering the personal strengths of resilience and gratitude together with self-esteem, which is an important self-related personal resource and widely used indicator of psychosocial adjustment.
In summary, the present studies investigated affective profiles and profile differences on psychosocial adjustment while considering cultural specificity and the longitudinal relationship between affective profiles and comprehensive indicators of adjustment (including resilience and gratitude). To improve the transferability and reliability of the findings, we conducted the studies on both a general population and a vulnerable population for whom affective well-being has been identified as important for their psychosocial adjustment (Chen et al., 2017; Lennarz et al., 2018; Li et al., 2017; Offer, 2013). To explore the affective profiles we used, latent profile analysis (LPA), which is a person-centered approach that can classify individuals into homogenous groups with similar response patterns and keep the heterogeneity of response patterns between profiles while considering individual differences (Berlin et al., 2014). Specifically, we explored affective profiles in a Chinese context among the vulnerable population of adults with ACEs (Study 1) and the general population of adolescents (Study 2) and examined profile differences in psychological adjustment, including mental health (i.e., depressive symptoms and anxiety), life satisfaction, and personal strengths (i.e., self-esteem, gratitude, and resilience) in a cross-sectional (Study 1) and longitudinal design (Study 2).
Study 1
Method
Participants
The participants in Study 1 were Chinese adults who had lost one or both parents to AIDS or lived with one or both HIV positive parents in childhood. These participants were from a large longitudinal project on the psychosocial adjustment of children affected by parental HIV. The data collection was conducted in two rural counties in central China where a great number of residents had been infected with HIV through unhygienic blood collection. The data were collected in the period of 2006–2008 (Waves 1–3) and in 2018 (Wave 4). The participants were aged 6–18 years at the first wave of data collection, and included AIDS orphans, children living with HIV-infected parents, and comparison children without experience of HIV-related illness or death in the family. The sample size in the four waves was 1625, 1288, 1019, and 642, respectively. The vulnerable population (n = 1221) in Study 1 were individuals affected by parental HIV, including AIDS orphans and children living with HIV-infected parents. Because the key variables (PA and NA) were only assessed in Wave 4, only data from the fourth wave of this longitudinal dataset were used. After excluding invalid responses (those that did not answer the scale on PA and NA), the final sample size of adults who had experienced parental HIV in childhood was 488. A multivariate analysis of variance (MANOVA) was used to conduct attrition analyses, with the results showing no differences between the attrited and retained participants on demographic variables (age, sex, educational levels of parents, type of adversity) at Wave 1, F(5,1134) = 1.987, p = .078, Wilk’s lambda = 0.991, partial eta squared = 0.009. Table S1 in the supplementary material shows the sample sizes and retention rates of the participants across the four waves. The participants were aged from 18 to 29 years (M = 23.57; SD = 2.44). Male participants accounted for 52.9% (n = 258) of the sample. Half of the participants had an educational background of primary school or middle school, and almost half had achieved the educational level of high school (25%) or held a bachelor’s degree (25%). Participants’ average monthly income was 3,307 RMB (SD = 2008.01, approximately US$500).
Procedure
The research protocol was approved by the research ethics panel of the Wayne State University, Henan University, and University of Macau before data collection. At least three attempts were made to contact participants who had joined the project in their childhood, including through relatives and schoolteachers or by making repeated home visits. Those who showed interest in the project were invited to provide their informed consent and complete the questionnaire. For participants who had migrated to other places, research assistants negotiated with them on the time for data collection. For those who had permanently relocated, the questionnaire and instruction brochures were mailed to them and they were asked to mail or fax electronic signatures and ship the completed questionnaire back to the research assistants. Electronic questionnaires were adopted if the participants preferred to answer the questionnaire online. Participants were compensated 50 RMB (approximately US$7) for their time.
Measures
Positive affect and negative affect. Participants’ PA and NA in the recent half-year were measured by the Positive and Negative Affect Schedule (PANAS; Watson et al., 1988). PA and NA were assessed by 10 items each on a 5-point Likert scale ranging from 1 (very slightly or not at all) to 5 (extremely). Cronbach’s α of the PA and NA subscales were 0.90 and 0.89, respectively.
Mental health problems. Mental health problems were assessed by depressive symptoms and anxiety. The Center for Epidemiological Studies Depression Scale (CES-D) was applied to measure depressive symptoms (Radloff, 1977). The scale includes 20 items with a 4-point scale measuring the frequency of depressive symptoms over the past week, from 0 (not at all) to 3 (a lot). Cronbach’s α of the CES-D in the present study was 0.92. Anxiety (average level) was measured by the trait anxiety subscale of the State-Trait Anxiety Inventory (Spielberg et al., 1970). It was assessed by 20 items on a 4-point scale ranging from 1 (not at all) to 4 (very much). Cronbach’s α for the trait anxiety subscale was 0.83.
Personal strengths. Personal strengths were assessed by self-esteem, gratitude, and resilience. The Rosenberg Self-Esteem Scale (RSE) was used to measure self-esteem (Rosenberg, 2015). Responses to 10 items were given on a 4-point scale ranging from 1 (strongly disagree) to 4 (strongly agree). Cronbach’s α of the RSE was 0.82. The Gratitude Questionnaire-Six (GQ-6) was used to measure grateful disposition by six items on a 7-point Likert scale ranging from 1 (strongly disagree) to 7 (strongly agree) (McCullough et al., 2002). Cronbach’s α of the GQ-6 was 0.85. Resilience was measured by the 10-item short version of the Connor–Davidson Resilience Scale (CD-RISC), with a 5-point Likert scale ranging from 1 (almost never) to 5 (almost always) (Campbell-Sills & Stein, 2007; Connor & Davidson, 2003). Cronbach’s α of the CD-RISC in the present study was 0.89.
Life satisfaction. The Satisfaction with Life Scale (SWLS) was used to measure life satisfaction (Diener et al., 1985). Five items were rated on a 7-point Likert scale ranging from 1 (strongly disagree) to 7 (strongly agree). Cronbach’s α of the SWLS in the present study was 0.84.
Covariates. The covariates included in the present study were age, sex, educational level, and monthly income.
Statistical analysis
SPSS (version 21) was used to complete the initial analysis (e.g., means, standard deviations, Cronbach’s alpha, and bivariate correlations) and Mplus (version 7.4) was used to conduct the LPA. The LPA is a person-centered approach that can classify individuals into homogenous groups with similar response patterns and maintain the heterogeneity of response patterns between the profiles (Berlin et al., 2014). Models with one to five latent profiles were analyzed to identify the optimal profiles while considering model fit indices, namely the Akaike information criterion (AIC), sample size adjusted Bayesian information criterion (aBIC), entropy, posterior probabilities in each profile, sample size of the smallest profile, Lo–Mendell–Rubin adjusted likelihood ratio test (LMR-LRT), and bootstrapped likelihood ratio test (BLRT) (Geiser, 2012). AIC and aBIC shows the balance of complexity and goodness of model fit. Entropy presents the overall accuracy of individuals’ classification (maximum of 1). The LMR-LRT and BLRT compare the improvement of model fit between a model with k profiles and the one with k−1 profiles. If a model with k−1 profiles (1) is not different from the one with k profiles; (2) has acceptable entropy and average posterior class probabilities in each profile (> 0.70); and (3) has a simple size of its smallest profile of no less than 1% of the total sample, then it is the model with the optimal profiles.
The differences of affective profiles on psychosocial adjustment were then analyzed while controlling for the covariates (age, sex, monthly income, and educational level) using the Bolck–Croon–Hagenaars (BCH) approach in Mplus (Asparouhov & Muthén, 2014). BCH integrates the most likely membership (the profile that an individual is most likely to be grouped into) with classification errors. Because BCH can examine the associations on the between-profile memberships and continuous outcomes while controlling the covariates, it is an optimal approach with high statistical power (Cao et al., 2019). At the beginning, the optimal LPA model with only the latent profile indicators was estimated for saving the BCH weights in the file for later analysis. BCH weights reflect the measurement error of the latent profile variable and are group-specific weights computed for each participant during model estimation (Asparouhov & Muthén, 2014; Lounassalo et al., 2019). In addition, all variables used in the second step were treated as auxiliary variables (without any specification in the first step) and saved with BCH weights in the same file. Next, the BCH weights were set as training data and a regression auxiliary model was estimated with the indicators of psychosocial adjustment on the covariates.
Results
Table S1 in the supplemental materials displays the descriptive information (i.e., bivariate correlations, means, standard deviations) of PA, NA, and indicators of psychosocial adjustment. PA was negatively associated with mental health problems (depressive symptoms and anxiety) and positively associated with personal strengths (self-esteem, gratitude, and resilience) and life satisfaction. On the contrary, NA was positively associated with negative indicators and negatively associated with positive indicators of psychosocial adjustment.
A series of unconditional models without covariates were first analyzed by LPA. The fit statistics for the five models with one to five profiles are presented in Table S2 in the supplementary materials. The model with three profiles was significant (LMR-LRT: p < .001) and did not differ from the model with four profiles (LMR-LRT: p = .30). In addition, as the model with three profiles had high entropy (entropy > 0.90), acceptable sample size of the smallest profile (> 1% of the total sample), and all the posterior probabilities were beyond 0.70, it was identified as.
the optimal model. Figure1 demonstrates the response patterns on the items of PA and NA in the three-profile model. The numbers of participants assigned to Profiles 1 to 3 were 164 (33.7%), 227 (46.5%), 97 (19.8%), respectively.
Fig. 1.
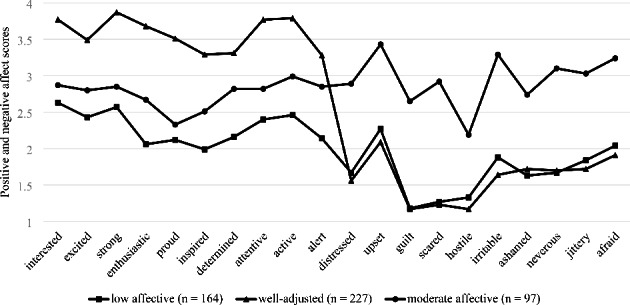
Patterns of PA and NA in the Three-Profile Model (Adults with ACE)
Table1 displays the between-profile comparisons for PA and NA. Profile 1 was named low affective because individuals in this profile reported the lowest PA and NA among the three profiles; Profile 2 was named well-adjusted for the large discrepancy between positive and negative affect (the highest PA and lowest NA); Profile 3 was named moderate affective because members in this profile reported moderate levels of PA and NA (both near the midpoint of the scale).
Table 1.
Statistical Descriptions of Between-Profile Comparisons of PA and NA (Adults with ACE)
| Affect | Mean (SE) | Main effect | WA vs. LA | MA vs. LA | MA vs. WA | ||
|---|---|---|---|---|---|---|---|
| LA | WA | MA | Diff [95% CI] | Diff [95% CI] | Diff [95% CI] | ||
| PA | 2.30 (0.037) | 3.57 (0.032) | 2.75 (0.048) | 355.42*** | 1.28*** [1.16, 1.40] | 0.45*** [0.31, 0.60] | −0.82***[−0.96, −0.68] |
| NA | 1.68 (0.033) | 1.59 (0.028) | 2.95 (0.043) | 377.66*** | −0.08 [−0.19, 0.02] | 1.27***[1.14, 1.40] | 1.36*** [1.23, 1.48] |
Note. PA = positive affect, NA = negative affect, LA = low affective profile, WA = well-adjusted profile, MA = moderate affective profile. ***p < .0003 (= 0.001/3). p-values were adjusted using Bonferroni corrections
Statistical descriptions of the between-profile comparisons on psychosocial adjustment are displayed in Table2. Individuals in the well-adjusted profile reported the highest levels of personal strengths and life satisfaction and the lowest levels of mental health problems. Compared with participants in the moderate affective profile, those in the low affective profile reported lower levels of mental health problems and a higher level of self-esteem.
Table 2.
Description of Between-Profile Comparisons on Psychosocial Adjustment (Adults with ACE)
| Mean | WA vs. LA | MA vs. LA | MA vs. WA | ||||
|---|---|---|---|---|---|---|---|
| LA | WA | MA | Diff (Cohen’s d) | Diff (Cohen’s d) | Diff (Cohen’s d) | ||
| Mental health problems | |||||||
| Depressive symptoms | 0.743 | 0.453 | 1.147 | −0.291*** (-0.562) | 0.403*** (0.645) | 0.694*** (1.215) | |
| Anxiety | 2.237 | 1.880 | 2.499 | −0.357*** (−1.056) | 0.262*** (0.730) | 0.619*** (1.565) | |
| Personal strengths | |||||||
| Self-esteem | 2.824 | 3.135 | 2.698 | 0.311*** (0.890) | −0.13* (−0.341) | −0.44*** (−1.105) | |
| Gratitude | 5.026 | 5.893 | 5.204 | 0.867*** (0.854) | 0.178 (0.156) | −0.69*** (−0.629) | |
| Resilience | 3.238 | 3.967 | 3.283 | 0.729*** (1.1) | 0.045 (0.063) | −0.68*** (−0.995) | |
| Life satisfaction | 4.204 | 4.753 | 4.025 | 0.549*** (0.451) | −0.18 (−0.152) | −0.73*** (−0.592) | |
Note. LR = low affective profile, WA = well-adjusted profile, MR = moderate affective profile. **p < .003 (= 0.01/3). ***p < .0003 (= 0.001/3). p-values were adjusted using Bonferroni corrections
Study 2
Method
Participants
The participants in Study 2 were adolescents (from two middle schools, with eight classes from each school) from an intervention project promoting growth mindset of intelligence and socioeconomic status (SES). Individuals holding a growth mindset of SES and intelligence believe that SES and intelligence are malleable and changeable through effort. This intervention project aimed at improving developmental outcomes (e.g., academic achievement, school engagement, and grit) by increasing the growth mindset of SES and intelligence among adolescents. Eight classes of students were randomly assigned into three intervention groups (mindset of SES group, mindset of intelligence group, mindset of SES plus intelligence group) and one control group, with two classes in each group. Each intervention session lasted for 40min. The students in the intervention groups had a trained teacher. The survey was conducted at pretest (baseline survey) at Wave 1 and post-test after the intervention at Wave 2 (6 months later). The sample size in Wave 1 and Wave 2 were 686 and 660, respectively. After excluding invalid responses (i.e., responses without ID, cases that did not participate in data collection at both waves such as transferred students, and cases that did not give a response on the measurement of PA and NA at Wave 1), the final sample for analysis was 635 students (53.39% boys) aged from 11 to 15 years (M = 12.56, SD = 0.63).
Procedure
Ethical approval was obtained from the research ethics panel at the University of Macau before data collection. Students of two middle schools in Guangzhou participated in this project. Students in Grade 7 were invited to complete the survey in Wave 1 and then asked to continue to participate the survey when they were in Grade 8 in Wave 2. Before data collection, students and their parents were informed about the research purpose and procedure and gave their informed consent. Students participated voluntarily and could withdraw from the study without any negative consequences. A small gift was offered to each participant as appreciation for their participation.
Measures
The same measurement used for personal strengths (i.e., self-esteem, gratitude, and resilience) and life satisfaction in Study 1 were used in Study 2. Unlike the PANAS in Study 1, which measured participants’ affect in the recent half-year, the PANAS in Study 2 assessed the general levels of affect. Depressive symptoms in the past week were assessed by the short form of the CES-D (Andresen et al., 1994; Radloff, 1977). This scale includes 10 items with a 4-point scale ranging from 0 (rarely or none of the time) to 3 (all the time). Anxiety in the past week was measured by the anxiety subscale of The Youth Self-Report questionnaire (Ferdinand, 2008). This scale contains seven items on a 3-point scale ranging from 0 (not true) to 3 (very true). Cronbach’s α of all measurements were at least 0.79 (see Table S4 in the supplementary materials).
The covariates in Study 2 were age, sex, family SES, and the indicators of psychological adjustment in Wave 1. Family SES was computed by averaging the standardized father’s education level, mother’s education level, and family monthly income.
Statistical analysis
Study 2 used the same statistical approach as Study 1. SPSS (version 21) was used to conduct the initial analysis and LPA (conducted in Mplus version 7.4) was applied to identify the optimal profiles for PA and NA at Wave 1. To control the potential intervention effect of mindset of SES and intelligence on psychological adjustment, the indicators of psychological adjustment at Wave 2 were regressed on the intervention grouping variable (control group and intervention groups) and standardized residual scores were obtained for use as adjusted indicators of psychological adjustment in the subsequent analysis. The BCH approach was used to examine the profile differences on the indicators of psychological adjustment in Wave 2 while controlling the covariates (age, sex, family SES, and indicators of psychological adjustment in Wave 1). The Bonferroni correction was used to account for the additive effects of type I error due to multiple comparisons. Thus, p values of less than 0.017 (= 0.05/3) were considered statistically significant.
Results
Table S3 in the supplementary materials displays the descriptive information (i.e., bivariate correlations, means, and standard deviations) of PA and NA at Wave 1 and the indicators of psychosocial adjustment at Wave 2. PA was negatively associated with mental health problems (depressive symptoms, anxiety) and positively associated with personal strengths (self-esteem, gratitude, resilience) and life satisfaction. On the contrary, NA was positively associated with negative indicators and negatively associated with positive indicators of psychosocial adjustment.
Five models with one to five profiles were analyzed by LPA, with the model fit indices presented in Table S4 in the supplementary materials. The model with three profiles was significant (LMR-LRT: p = .023) and did not differ from the model with four profiles (LMR-LRT: p = .322). In addition, it was the optimal model with high entropy and posterior probabilities, and acceptable sample size. Figure2 demonstrates the response patterns for the items of PA and NA in the three-profile model. The numbers of participants assigned to Profiles 1 to 3 were 176 (27.7%), 311 (49%), and 148 (23.3%), respectively.
Fig. 2.
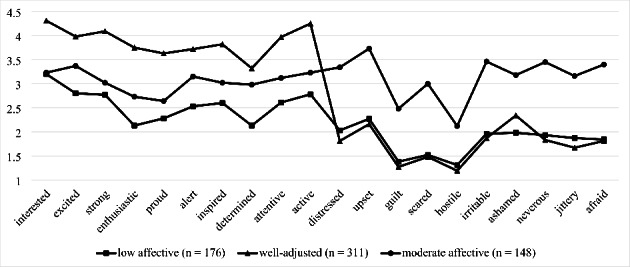
Patterns of PA and NA in the Three-Profile Model (Adolescents)
Table3 displays the between-profile comparisons for PA and NA. Similar to the results of Study 1, three profiles with similar patterns were identified. Profile 1 was named low affective because individuals in this profile reported the lowest PA and NA among the three profiles; Profile 2 was named well-adjusted for the highest PA and lowest NA; Profile 3 was named moderate affective because members in this profile reported moderate levels of PA and NA.
Table 3.
Statistical Descriptions of Between-Profile Comparisons on PA and NA (Adolescents)
| Affect | Mean (SE) | Main effect | WA vs. LA | MA vs. LA | MA vs. WA | ||
|---|---|---|---|---|---|---|---|
| LA | WA | MA | Diff [95% CI] | Diff [95% CI] | Diff [95% CI] | ||
| PA | 2.58 (0.04) | 3.88 (0.03) | 3.05 (0.04) | 365.21*** | 1.30*** [1.18, 1.42] | 0.47*** [0.33, 0.61] | −0.83*** [−0.96, −0.70] |
| NA | 1.81 (0.03) | 1.75 (0.03) | 3.14 (0.04) | 557.81*** | −0.06 [−0.16, 0.04] | 1.33*** [1.21, 1.45] | 1.39*** [1.29, 1.50] |
Note. PA = positive affect, NA = negative affect, LA = low affective profile, WA = well-adjusted profile, MA = moderate affective profile. ***p < .0003 (= 0.001/3), p-values were adjusted using Bonferroni corrections
Statistical descriptions for the between-profile comparisons on psychosocial adjustment are displayed in Table4. Individuals in the well-adjusted profile reported the highest levels of personal strengths and life satisfaction and the lowest level of mental health problems. Compared with participants in the moderate affective profile, those in the low affective profile reported lower levels of mental health problems.
Table 4.
Description of Between-Profile Comparisons on Psychosocial Adjustment (Adolescents)
| Mean | WA vs. LA | MA vs. LA | MA vs. WA | ||||
|---|---|---|---|---|---|---|---|
| LA | WA | MA | Diff (Cohen’s d) | Diff (Cohen’s d) | Diff (Cohen’s d) | ||
| Mental health problems | |||||||
| Depressive symptoms | 0.041 | −0.328 | 0.644 | −0.369*** (−0.398) | 0.603*** (0.555) | 0.972*** (0.915) | |
| Anxiety | −0.048 | −0.240 | 0.562 | −0.192 (−0.191) | 0.610*** (0.573) | 0.802*** (0.765) | |
| Personal strengths | |||||||
| Self-esteem | −0.213 | 0.348 | −0.474 | 0.561*** (0.589) | −0.261 (−0.252) | −0.822*** (−0.769) | |
| Gratitude | −0.238 | 0.295 | −0.341 | 0.533*** (0.502) | −0.103 (−0.097) | −0.636*** (−0.635) | |
| Resilience | −0.275 | 0.393 | −0.499 | 0.668*** (0.683) | −0.224 (−0.207) | −0.892*** (−0.866) | |
| Life satisfaction | −0.173 | 0.263 | −0.358 | 0.436*** (0.429) | −0.185 (−0.167) | −0.621*** (−0.582) | |
Note. LA = low affective profile, WA = well-adjusted profile, MA = moderate affective profile. All means of indicators of psychological adjustment were standardized residual scores to eliminate the intervention effect of the mindset of SES and intelligence interventions. ***p < .0003 (= 0.001/3). p-values were adjusted using Bonferroni corrections
Discussion
Consistent with previous findings (Zou et al., 2021), three affective profiles were identified among both a vulnerable population (adults who had been affected by parental HIV in childhood) and a general population (adolescents) of Chinese people in the present two studies, specifically a well-adjusted profile (high PA and low NA), low affective profile (low PA and low NA), and moderate affective profile (moderate PA and moderate NA). Two dialectical (low affective and moderate affective) and one non-dialectical affective profile (well-adjusted) were found in the two samples, highlighting the collectivist cultural specificity of the populations.
Influenced by dialectical thinking, most Chinese people are more likely to accept emotional complexity (e.g., the co-existence of PA and NA) (Eid & Diener, 2001; Tangney & Fischer, 1995). Accordingly, a great number of participants kept a balance between PA and NA (at both low and moderate levels) and maintained especially a moderate affective profile, which is less likely to be found in Western samples (Ganotice et al., 2016; Miyamoto & Ryff, 2011). The absence of a high affective profile (high PA and high NA) may be due to the preference of avoiding the experience of high arousal emotions in Chinese culture. Different from people in individualistic cultures, who are encouraged to influence the environment (e.g., to fulfill their personal needs by changing others’ needs), people in collectivistic cultures tend to adjust themselves to fit the environment (e.g., to suppress their personal needs to meet the need of others) (Tsai et al., 2007). Thus, compared with Westerners who place more value on high arousal emotions (e.g., excitement and enthusiasm), Easterners place more value on low arousal emotions (e.g., calm and peacefulness) (Lim, 2016; Tsai et al., 2007). Because most of the affect measured by the PANAS is high arousal (Lim, 2016), it is reasonable that moderate rather than high levels of PA and NA were found among the Chinese samples.
In addition, nearly half of participants were in the well-adjusted profile (high PA and low NA). This illustrates that the hedonic emotional experiences in Western culture are also common in Chinese people (Deng et al., 2013). Both the vulnerable and general sample in this profile had adjusted well and demonstrated a high level of PA and low level of NA in their lives. The lack of the affective profile of high NA and low PA may suggest that most of the participants in these two populations are adaptive to changes in their developmental stages or able to deal with the stress induced by ACE in a relatively functional way. Another potential reason for the lack of this profile in the vulnerable sample might be the number and severity of ACEs. Individuals suffering multiple and severe ACEs and receiving less social support might be more likely to quit from the longitudinal study, which may explain the null representation of the affective profile with high NA and low PA in the current study. In prior studies, individuals with high NA and low PA usually had the highest levels of mental health problems (e.g., peritraumatic symptoms, subjective and objective stress) and lowest levels of psychological well-being of all the affective profiles (Garcia et al., 2014; Palgi et al., 2012; Robertson et al., 2007).
Differences across profiles in psychosocial adjustment represent the nature of PA and NA and their function in psychosocial adjustment. Among the three profiles, individuals in the well-adjusted profile had the fewest mental health problems (depressive symptoms and anxiety) and highest levels of personal strengths (self-esteem, gratitude, and resilience) and life satisfaction. This is consistent with previous findings that people with a high level of PA and low level of NA are more likely to be happier, more satisfied with their lives and selves, less depressed, and engaging more often in happiness-increasing activities comprising autonomous, self-developing, and pro-relationship values (Di Fabio & Bucci, 2015; Schütz et al., 2013). To some extent, the well-adjusted profile manifests the resilience of adults in preventing the long-term negative effects of adversities, the healthy adaptation of adolescents to challenges, and the use of the adaptive function of gratitude (Garcia & Moradi, 2013; Stein et al., 2014; Vieselmeyer et al., 2017).
Our findings also suggest the substantial role of PA in psychosocial adjustment, especially when NA is at a low level. Compared with people in the low affective profile, people in the well-adjusted profile reported similarly low NA but higher PA and better psychosocial adjustment (fewer depressive symptoms and higher levels of personal strengths and life satisfaction). This supports the beneficial function of PA in facilitating positive outcomes (e.g., post-traumatic growth) and its protective role in helping people reduce negative outcomes (e.g., depression) (Li et al., 2017; Rzeszutek, 2017). PA is not only helpful for building up personal psychological resources, such as resilience and sense of self-worth, but also for undoing the adverse impacts of NA (e.g., serving as an anti-depressive factor or protector of life satisfaction) (Fredrickson, 2013; Lindahl & Archer, 2013; Schütz et al., 2013; Tugade & Fredrickson, 2004).
Intriguingly, we found that people in the moderate affective profile perceived more mental health problems than individuals in the low affective profile. Compared with the individuals in the low affective profile, even though people in the moderate affective profile reported higher PA, it appears that their higher NA may have weakened the beneficial effect of higher PA on mental health and self-regard, which led to lower levels in these indicators of psychosocial adjustment. Previous studies have found a uniquely negative effect of NA on physical health and a diminishing role of NA in the relationship between PA and physical health among people living with HIV and affected by parental HIV (Chen et al., 2017; Wilson et al., 2017). Alternatively, people in the low affective profile may present low emotionality (e.g., feeling nothing or having little emotional arousal), which could be thought of as being “mellow” and using conservative emotion regulation strategies to protect themselves from the intense arousal of both unpleasant and pleasant emotional states (e.g., affect constriction and reducing reaction to negative and positive stimuli by paying attention to neutral stimuli) (Hassett et al., 2008; Norlander et al., 2005; Palgi et al., 2012). This might be effective in maintaining relatively high autonomy and adapting to a prolonged stress situation (Garcia et al., 2014; Palgi et al., 2012).
Several limitations of these two studies need to be addressed. First, the present studies only explored the affective profiles at a single time and did not explore the developmental trajectories of affect over time (Zhang et al., 2021). Trajectories of affective patterns could be explored in future studies. Second, the present studies are exploratory rather than confirmatory and our findings are limited in generalizability due to the characteristics of the two populations (adults with parental HIV experience, and general adolescents) in the Chinese context. People suffering other types of adversities (e.g., intimate partner violence or emotional disorders) and with other individual differences (e.g., at different life stages) in this and other cultures could be research targets in the future. The lack of low PA and high NA, and high PA and high NA profiles in the present findings may be due to the specific characteristics (e.g., cultural factors) of our sample, which could be further explored in different contexts (e.g., another collectivistic culture). Third, we only considered the valence (positive vs. negative) of affect and did not take arousal levels (high vs. low) into account. Most affect measured by the PANAS is high arousal (Lim, 2016). However, negative emotions could include different facets when the level of arousal is considered (Möwisch et al., 2019). Different from the high-activation positive valence PA (e.g., excited or enthusiastic) measured through PANAS (Pressman et al., 2019), low-activation positive valence PA (e.g., calm, relaxed, or content) is soothing and has unique predictive qualities for anxiety, stress, and mindfulness (McManus et al., 2019). To capture the full effects, future studies could explore the affective profiles while simultaneously testing the valance and arousal level of emotions.
The present studies have theoretical and practical implications. Consistent findings on affective profiles and profile differences on psychosocial adjustment across vulnerable and general populations provide solid evidence for the robustness of the identified affective profiles and the effects of PA and NA on psychosocial adjustment in the Chinese context. The relatively high percentage (above 50%) of dialectical affective profiles (moderate affective and low affective) in the two populations confirms that the cultural script (dialectical thinking in Chinese) influences individuals’ affective experiences (Miyamoto et al., 2014; Miyamoto & Ryff, 2011). Moreover, the present studies found that people with high PA and low NA were more adaptive in adjusting to daily life and that people in the low dialectical affective profile adjusted better than those in the moderate dialectical profile. In practice, because the participants in the well-adjusted profile had the best psychosocial adjustment, increasing high PA and decreasing low PA could be encouraged and become the objective of interventions on affective well-being. In addition, practitioners should consider affective profiles and take into account individual differences when developing developmentally and culturally sensitive interventions to improve the capability of emotion regulation (e.g., strategies of managing emotions) of individuals with ACE (Harrison et al., 2018).
Electronic supplementary material
Below is the link to the electronic supplementary material.
Acknowledgements
This manuscript is not under review elsewhere and the results have not been published previously or accepted for publication. This manuscript has been seen and approved by all authors.
Authors’ contributions:
Conceptualization: Qinglu Wu, Xiaoming Li, Hongfei Du, Peilian Chi, Junfeng Zhao, Guoxiang Zhao; Methodology: Junfeng Zhao, Guoxiang Zhao, Xiaoming Li, Peilian Chi; Formal analysis and investigation: Qinglu Wu; Writing-original draft preparation: Qinglu Wu; Writing-review and editing: Hongfei Du, Peilian Chi; Funding acquisition: Peilian Chi; Resources: Junfeng Zhao, Guoxiang Zhao.
Funding
Preparation of this manuscript was support by National Natural Science Foundation of China under Grant [31700972], the Research Council at University of Macau under Grant [MYRG2018-00098-FSS], National Institute of Nursing Research (R01NR13466),Fundamental Research Funds for the Central Universities [310432101], and the Foundation for Young Talents in Higher Education of Guangdong Province [2021WQNCX307]. The funding body did not influence the study at any stage (i.e., during design, data collection, analysis, and interpretation of the data and writing the manuscript).
Declarations
Conflict of interest
No potential conflict of interest was reported by the authors.
Compliance of ethical standard statement
The questionnaire and methodology for this study was approved by the research ethics committee at the Wayne State University, Henan University, and University of Macau before data collection.
Consent to participants
Informed consent was obtained from all participants included in the study.
Consent for publication
Participants consented that the anonymized data could be kept and used for research purpose.
Footnotes
Publisher’s Note
Springer Nature remains neutral with regard to jurisdictional claims in published maps and institutional affiliations.
Contributor Information
Qinglu Wu, Email: qinglu-wu@hotmail.com.
Junfeng Zhao, Email: zhaojf@henu.edu.cn.
Guoxiang Zhao, Email: zhaogx@henu.edu.cn.
Xiaoming Li, Email: xiaoming@mailbox.sc.edu.
Hongfei Du, Email: dhfpsy@gmail.com.
Peilian Chi, Email: peilianchi@um.edu.mo.
References
- Andresen EM, Malmgren JA, Carter WB, Patrick DL. Screening for depression in well older adults: Evaluation of a short form of the CES-D. American Journal of Preventive Medicine. 1994;10:77–84. doi: 10.1016/S0749-3797(18)30622-6. [DOI] [PubMed] [Google Scholar]
- Asparouhov, T., & Muthén, B. (2014). Auxiliary variables in mixture modeling: Using the BCH method in Mplus to estimate a distal outcome model and an arbitrary secondary model [Technical report comment]
- Berlin KS, Williams NA, Parra GR. An introduction to latent variable mixture modeling (part 1): Overview and cross-sectional latent class and latent profile analyses. Journal of Pediatric Psychology. 2014;39(2):174–187. doi: 10.1093/jpepsy/jst084. [DOI] [PubMed] [Google Scholar]
- Campbell-Sills L, Stein MB. Psychometric analysis and refinement of the connor–davidson resilience scale (CD-RISC): Validation of a 10-item measure of resilience. Journal of Traumatic Stress. 2007;20(6):1019–1028. doi: 10.1002/jts.20271. [DOI] [PubMed] [Google Scholar]
- Cao H, Li X, Chi P, Du H, Wu Q, Liang Y, Zhou N, Fine MA. Within-couple configuration of gender‐related attitudes and its association with marital satisfaction in Chinese marriage: A dyadic, pattern‐analytic approach. Journal of Personality. 2019;87(6):1189–1205. doi: 10.1111/jopy.12467. [DOI] [PubMed] [Google Scholar]
- Chen L, Chi P, Li X, Zilioli S, Zhao J, Zhao G, Lin D. The effects of trait and state affect on diurnal cortisol slope among children affected by parental HIV/AIDS in rural China. Aids Care. 2017;29(8):1034–1040. doi: 10.1080/09540121.2016.1274015. [DOI] [PMC free article] [PubMed] [Google Scholar]
- Chi P, Li X. Impact of parental HIV/AIDS on children’s psychological well-being: A systematic review of global literature. AIDS and Behavior. 2013;17(7):2554–2574. doi: 10.1007/s10461-012-0290-2. [DOI] [PMC free article] [PubMed] [Google Scholar]
- Ciarrochi J, Heaven PCL. Longitudinal examination of the impact of Eysenck’s psychoticism dimension on emotional well-being in teenagers. Personality and Individual Differences. 2007;42(3):597–608. doi: 10.1016/j.paid.2006.07.022. [DOI] [Google Scholar]
- Cloitre M, Khan C, Mackintosh MA, Garvert DW, Henn-Haase CM, Falvey EC, Saito J. Emotion regulation mediates the relationship between ACES and physical and mental health. Psychological Trauma: Theory Research Practice and Policy. 2019;11(1):82–89. doi: 10.1037/tra0000374. [DOI] [PubMed] [Google Scholar]
- Connor KM, Davidson JRT. Development of a new resilience scale: The Connor-Davidson Resilience Scale (CD-RISC) Depression and Anxiety. 2003;18(2):76–82. doi: 10.1002/da.10113. [DOI] [PubMed] [Google Scholar]
- Deng X, Sang B, Luan Z. Up- and down-regulation of daily emotion: An experience sampling study of Chinese adolescents’ regulatory tendency and effects. Psychological Reports. 2013;113(2):552–565. doi: 10.2466/09.10.PR0.113x22z4. [DOI] [PubMed] [Google Scholar]
- Dey NEY, Amponsah B, Wiafe-Akenteng CB. Spirituality and subjective well-being of Ghanaian parents of children with special needs: The mediating role of resilience. Journal of Health Psychology. 2021;26(9):1377–1388. doi: 10.1177/1359105319873956. [DOI] [PubMed] [Google Scholar]
- Di Fabio A, Bucci O. Affective profiles in Italian high school students: Life satisfaction, psychological well-being, self-esteem, and optimism. Frontiers in psychology. 2015;6:1310. doi: 10.3389/fpsyg.2015.01310. [DOI] [PMC free article] [PubMed] [Google Scholar]
- Diener E, Emmons RA, Larsen RJ, Griffin S. The Satisfaction With Life Scale. Journal of Personality Assessment. 1985;49(1):71–75. doi: 10.1207/s15327752jpa4901_13. [DOI] [PubMed] [Google Scholar]
- Diener E, Oishi S, Lucas RE. Personality, culture, and subjective well-being: Emotional and cognitive evaluations of life. Annual Review of Psychology. 2003;54(1):403–425. doi: 10.1146/annurev.psych.54.101601.145056. [DOI] [PubMed] [Google Scholar]
- Eid M, Diener E. Norms for experiencing emotions in different cultures: Inter- and intranational differences. Journal of Personality and Social Psychology. 2001;81:869–885. doi: 10.1007/978-90-481-2352-0_9. [DOI] [PubMed] [Google Scholar]
- Ferdinand RF. Validity of the CBCL/YSR DSM-IV scales Anxiety Problems and Affective Problems. Journal of Anxiety Disorders. 2008;22(1):126–134. doi: 10.1016/j.janxdis.2007.01.008. [DOI] [PubMed] [Google Scholar]
- Fernández-Berrocal, P., Gutiérrez-Cobo, M. J., Rodriguez-Corrales, J., & Cabello, R. (2017). Teachers’ affective well-being and teaching experience: The protective role of perceived emotional intelligence. Frontiers in psychology, 8(2227), 10.3389/fpsyg.2017.02227 [DOI] [PMC free article] [PubMed]
- Fredrickson, B. L. (2013). Positive emotions broaden and build. In P. Devine & A. Plant (Eds.), Advances in Experimental Social Psychology (Vol.47, pp.1–53). Academic Press. 10.1016/B978-0-12-407236-7.00001-2
- Ganotice FA, Datu JAD, King RB. Which emotional profiles exhibit the best learning outcomes? A person-centered analysis of students’ academic emotions. School Psychology International. 2016;37(5):498–518. doi: 10.1177/0143034316660147. [DOI] [Google Scholar]
- Garcia D, Moradi S. The affective temperaments and well-being: Swedish and Iranian adolescents’ life satisfaction and psychological well-being. Journal of Happiness Studies. 2013;14:689–707. doi: 10.1007/s10902-012-9349-z. [DOI] [Google Scholar]
- Garcia, D., Al Nima, A., & Kjell, O. N. E. (2014). The affective profiles, psychological well-being, and harmony: Environmental mastery and self-acceptance predict the sense of a harmonious life. PeerJ, 2, e259. 10.7717/peerj.259 [DOI] [PMC free article] [PubMed]
- Garcia D, Sailer U, Nima A, Archer T. Questions of time and affect: A person’s affectivity profile, time perspective, and well-being. PeerJ. 2016;4:e1826. doi: 10.7717/peerj.1826. [DOI] [PMC free article] [PubMed] [Google Scholar]
- Geiser, C. (2012). Data analysis with Mplus. Guilford press
- Harrison SE, Li X, Zhang J, Zhao J, Zhao G. A randomized controlled trial of a resilience-based intervention for children affected by parental HIV: Educational outcomes at 24-, 30-, and 36-months. School Psychology International. 2018;39(2):170–195. doi: 10.1177/0143034318760114. [DOI] [Google Scholar]
- Hassett AL, Simonelli LE, Radvanski DC, Buyske S, Savage SV, Sigal LH. The relationship between affect balance style and clinical outcomes in fibromyalgia. Arthritis Care & Research. 2008;59(6):833–840. doi: 10.1002/art.23708. [DOI] [PubMed] [Google Scholar]
- Jiang Y, Li X, Chen L, Zhou G, Zhao J, Zhao G. Peer victimization and diurnal cortisol rhythm among children affected by parental HIV: Mediating effects of emotional regulation and gender differences. Psychoneuroendocrinology. 2018;97:174–181. doi: 10.1016/j.psyneuen.2018.07.010. [DOI] [PMC free article] [PubMed] [Google Scholar]
- Lennarz HK, Lichtwarck-Aschoff A, Timmerman ME, Granic I. Emotion differentiation and its relation with emotional well-being in adolescents. Cognition and Emotion. 2018;32(3):651–657. doi: 10.1080/02699931.2017.1338177. [DOI] [PubMed] [Google Scholar]
- Li J, Mo PKH, Wu AMS, Lau JTF. Roles of self-stigma, social support, and positive and negative affects as determinants of depressive symptoms among HIV infected men who have sex with men in China. AIDS and Behavior. 2017;21(1):261–273. doi: 10.1007/s10461-016-1321-1. [DOI] [PMC free article] [PubMed] [Google Scholar]
- Lim N. Cultural differences in emotion: differences in emotional arousal level between the East and the West. Integrative Medicine Research. 2016;5(2):105–109. doi: 10.1016/j.imr.2016.03.004. [DOI] [PMC free article] [PubMed] [Google Scholar]
- Lindahl M, Archer T. Depressive expression and anti-depressive protection in adolescence: Stress, positive affect, motivation and self-efficacy. Psychology. 2013;4(6):495–505. doi: 10.4236/psych.2013.46070. [DOI] [Google Scholar]
- Lounassalo, I., Hirvensalo, M., Kankaanpää, A., Tolvanen, A., Palomäki, S., Salin, K., Fogelholm, M., Yang, X., Pahkala, K., Rovio, S., Hutri-Kähönen, N., Raitakari, O., & Tammelin, T. H. (2019). Associations of leisure-time physical activity trajectories with fruit and vegetable consumption from childhood to adulthood: The cardiovascular risk in young finns study. International Journal of Environmental Research and Public Health, 16(22), 4437. https://www.mdpi.com/1660-4601/16/22/4437 [DOI] [PMC free article] [PubMed]
- Luthans F, Avolio BJ, Avey JB, Norman SM. Positive psychological capital: Measurement and relationship with performance and satisfaction. Personnel Psychology. 2007;60(3):541–572. doi: 10.1111/j.1744-6570.2007.00083.x. [DOI] [Google Scholar]
- MacDonald S, Kormi-Nouri R. The affective personality, sleep, and autobiographical memories. The Journal of Positive Psychology. 2013;8(4):305–313. doi: 10.1080/17439760.2013.800904. [DOI] [Google Scholar]
- McCullough ME, Emmons RA, Tsang JA. The grateful disposition: A conceptual and empirical topography. Journal of Personality and Social Psychology. 2002;82(1):112–127. doi: 10.1037/0022-3514.82.1.112. [DOI] [PubMed] [Google Scholar]
- McManus MD, Siegel JT, Nakamura J. The predictive power of low-arousal positive affect. Motivation and Emotion. 2019;43(1):130–144. doi: 10.1007/s11031-018-9719-x. [DOI] [Google Scholar]
- Miyamoto Y, Ryff CD. Cultural differences in the dialectical and non-dialectical emotional styles and their implications for health. Cognition and Emotion. 2011;25(1):22–39. doi: 10.1080/02699931003612114. [DOI] [PMC free article] [PubMed] [Google Scholar]
- Miyamoto Y, Ma X, Petermann AG. Cultural differences in hedonic emotion regulation after a negative event. Emotion. 2014;14(4):804–815. doi: 10.1037/a0036257. [DOI] [PubMed] [Google Scholar]
- Möwisch D, Schmiedek F, Richter D, Brose A. Capturing affective well-being in daily life with the day reconstruction method: A refined view on positive and negative affect. Journal of Happiness Studies. 2019;20(2):641–663. doi: 10.1007/s10902-018-9965-3. [DOI] [Google Scholar]
- Norlander T, Bood S, Archer T. Performance during stress: Affective personality age, and regularity of physical exercise. Social Behavior and Personality. 2002;30(5):495–508. doi: 10.2224/sbp.2002.30.5.495. [DOI] [Google Scholar]
- Norlander T, Johansson Å, Bood S. The affective personality: Its relation to quality of sleep, well-being and stress. Social Behavior and Personality. 2005;33(7):709–722. doi: 10.2224/sbp.2005.33.7.709. [DOI] [Google Scholar]
- Offer S. Family time activities and adolescents’ emotional well-being. Journal of Marriage and Family. 2013;75(1):26–41. doi: 10.1111/j.1741-3737.2012.01025.x. [DOI] [Google Scholar]
- Palgi Y, Ben-Ezra M, Shrira A. The effect of prolonged exposure to war-related stress among hospital personnel with different affect types: Lessons from the Second Lebanon War and the Gaza “Cast Lead” operation. European Journal of Psychotraumatology. 2012;3(1):7165. doi: 10.3402/ejpt.v3i0.7165. [DOI] [PMC free article] [PubMed] [Google Scholar]
- Peng K, Nisbett RE. Culture, dialectics, and reasoning about contradiction. American Psychologist. 1999;54(9):741–754. doi: 10.1037/0003-066X.54.9.741. [DOI] [Google Scholar]
- Pressman SD, Jenkins BN, Moskowitz JT. Positive affect and health: What do we know and where next should we go? Annual Review of Psychology. 2019;70(1):627–650. doi: 10.1146/annurev-psych-010418-102955. [DOI] [PubMed] [Google Scholar]
- Puckett JA, Matsuno E, Dyar C, Mustanski B, Newcomb ME. Mental health and resilience in transgender individuals: What type of support makes a difference? Journal of Family Psychology. 2019;33(8):954–964. doi: 10.1037/fam0000561. [DOI] [PMC free article] [PubMed] [Google Scholar]
- Radloff LS. The CES-D scale: A self-report depression scale for research in the general population. Applied Psychological Measurement. 1977;1(3):385–401. doi: 10.1177/014662167700100306. [DOI] [Google Scholar]
- Rapp Ricciardi, M., Åkerman, J., Eerikäinen, P., Ambjörnsson, A., Andersson Arntén, A. C., Mihailovic, M., Archer, T., & Garcia, D. (2014). Understanding Group and Leader (UGL) trainers’ personality characteristics and affective profiles. Frontiers in psychology, 5(1191), 10.3389/fpsyg.2014.01191 [DOI] [PMC free article] [PubMed]
- Ratchford JL, Schnitker SA, Reppas P. The virtue of thrift: A person-centered conceptualization and measure development. Journal of Happiness Studies. 2020 doi: 10.1007/s10902-020-00235-7. [DOI] [Google Scholar]
- Robertson SM, Zarit SH, Duncan LG, Rovine MJ, Femia EE. Family caregivers’ patterns of positive and negative affect. Family Relations. 2007;56(1):12–23. doi: 10.1111/j.1741-3729.2007.00436.x. [DOI] [Google Scholar]
- Rosenberg, M. (2015). Society and the adolescent self-image. Princeton university press
- Rzeszutek M. Social support and posttraumatic growth in a longitudinal study of people living with HIV: The mediating role of positive affect. European Journal of Psychotraumatology. 2017;8(1):1412225. doi: 10.1080/20008198.2017.1412225. [DOI] [PMC free article] [PubMed] [Google Scholar]
- Sanmartín R, Vicent M, Gonzálvez C, Inglés CJ, Reinoso-Pacheco R, García-Fernández JM. Factorial invariance, latent mean differences of the Panas and affective profiles and its relation to social anxiety in Ecuadorian sample. Sustainability. 2020;12(7):2976. doi: 10.3390/su12072976. [DOI] [Google Scholar]
- Schütz E, Sailer U, Nima A, Rosenberg A, Andersson Arntén P, Archer AC, Garcia D. The affective profiles in the USA: Happiness, depression, life satisfaction, and happiness-increasing strategies. PeerJ. 2013;1:e156. doi: 10.7717/peerj.156. [DOI] [PMC free article] [PubMed] [Google Scholar]
- Shiota MN, Campos B, Gonzaga GC, Keltner D, Peng K. I love you but … Cultural differences in complexity of emotional experience during interaction with a romantic partner. Cognition and Emotion. 2010;24(5):786–799. doi: 10.1080/02699930902990480. [DOI] [Google Scholar]
- Shoshani A, Aviv I. The pillars of strength for first-grade adjustment – Parental and children’s character strengths and the transition to elementary school. The Journal of Positive Psychology. 2012;7(4):315–326. doi: 10.1080/17439760.2012.691981. [DOI] [Google Scholar]
- Sims T, Tsai JL, Jiang D, Wang Y, Fung HH, Zhang X. Wanting to maximize the positive and minimize the negative: Implications for mixed affective experience in American and Chinese contexts. Journal of Personality and Social Psychology. 2015;109(2):292–315. doi: 10.1037/a0039276. [DOI] [PMC free article] [PubMed] [Google Scholar]
- Spielberg, C., Gorsuch, R., & Lushene, R. (1970). Test manual for the State-Trait Anxiety Inventory. Consulting psychologists press
- Stein, A., Desmond, C., Garbarino, J., Van IJzendoorn, M. H., Barbarin, O., Black, M. M., Stein, A. D., Hillis, S. D., Kalichman, S. C., Mercy, J. A., Bakermans-Kranenburg, M. J., Rapa, E., Saul, J. R., Dobrova-Krol, N. A., & Richter, L. M. (2014). Predicting long-term outcomes for children affected by HIV and AIDS: Perspectives from the scientific study of children’s development. AIDS, 28, S261-S268. 10.1097/qad.0000000000000328 [DOI] [PMC free article] [PubMed]
- Sun P, Kong F. Affective mediators of the influence of gratitude on life satisfaction in late adolescence. Social Indicators Research. 2013;114(3):1361–1369. doi: 10.1007/s11205-013-0333-8. [DOI] [Google Scholar]
- Tangney, J. P. E., & Fischer, K. W. (1995). Self-conscious emotions: The psychology of shame, guilt, embarrassment, and pride. Guilford Press
- Tsai JL, Miao FF, Seppala E, Fung HH, Yeung DY. Influence and adjustment goals: Sources of cultural differences in ideal affect. Journal of Personality and Social Psychology. 2007;92(6):1102–1117. doi: 10.1037/0022-3514.92.6.1102. [DOI] [PubMed] [Google Scholar]
- Tugade MM, Fredrickson BL. Resilient individuals use positive emotions to bounce back from negative emotional experiences. Journal of Personality and Social Psychology. 2004;86(2):320–333. doi: 10.1037/0022-3514.86.2.320. [DOI] [PMC free article] [PubMed] [Google Scholar]
- Vieselmeyer J, Holguin J, Mezulis A. The role of resilience and gratitude in posttraumatic stress and growth following a campus shooting. Psychological Trauma: Theory Research Practice and Policy. 2017;9(1):62–69. doi: 10.1037/tra0000149. [DOI] [PubMed] [Google Scholar]
- Watson D, Clark LA, Tellegen A. Development and validation of brief measures of positive and negative affect: The PANAS scales. Journal of Personality and Social Psychology. 1988;54(6):1063–1070. doi: 10.1037/0022-3514.54.6.1063. [DOI] [PubMed] [Google Scholar]
- Wilson TE, Weedon J, Cohen MH, Golub ET, Milam J, Young MA, Adedimeji AA, Cohen J, Fredrickson BL. Positive affect and its association with viral control among women with HIV infection. Health Psychology. 2017;36(1):91–100. doi: 10.1037/hea0000382. [DOI] [PMC free article] [PubMed] [Google Scholar]
- Wu Q, Chen C, Liang Y, Zhou N, Cao H, Du H, Lin X, Chi P. Not Only the Forest and Trees but Also the Ground They Are Rooted in: Identifying Profiles of Self-Compassion from the Perspective of Dialecticism. Mindfulness. 2020;11(8):1967–1977. doi: 10.1007/s12671-020-01406-6. [DOI] [Google Scholar]
- Zhang, L., Wang, L., Liu, Y., Zhang, J., Zhang, X., & Zhao, J. (2021). Resilience predicts the trajectories of college students’ daily emotions during COVID-19: A latent growth mixture model. Frontiers in psychology, 12. 10.3389/fpsyg.2021.648368 [DOI] [PMC free article] [PubMed]
- Zou W, Ding X, Xie L, Wang H. Relationship between higher education teachers’ affect and their psychological adjustment to online teaching during the COVID-19 pandemic: an application of latent profile analysis. PeerJ. 2021;9:e12432. doi: 10.7717/peerj.12432. [DOI] [PMC free article] [PubMed] [Google Scholar]
Associated Data
This section collects any data citations, data availability statements, or supplementary materials included in this article.