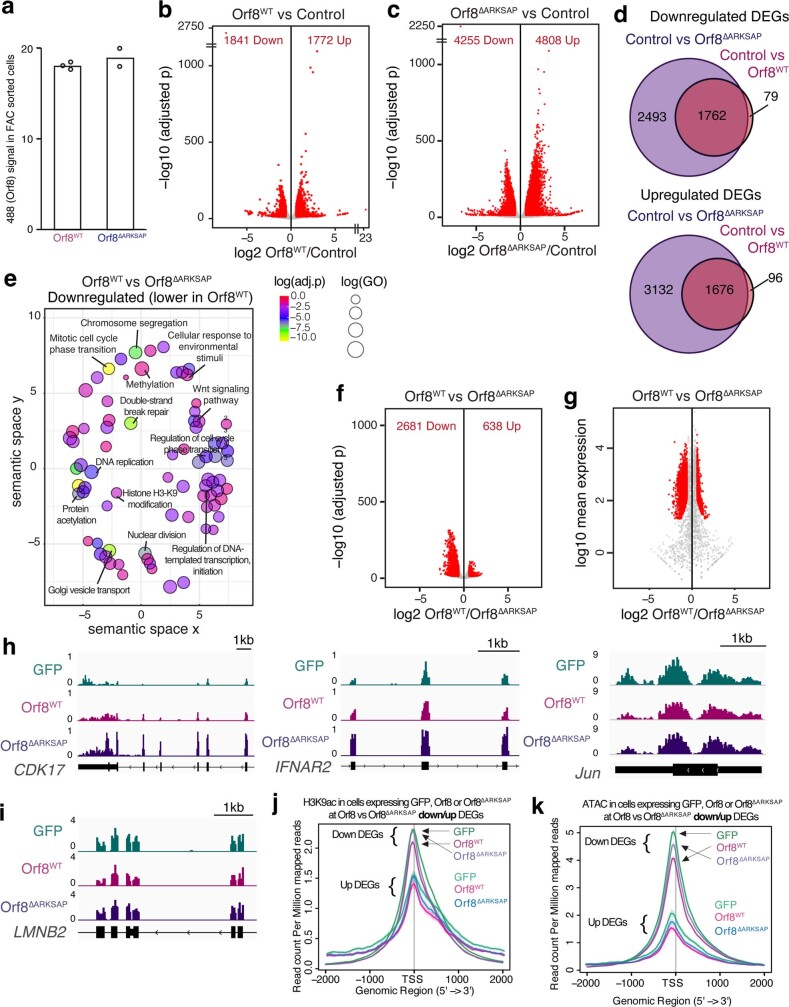
Extended Data Fig. 6. Orf8 disrupts gene expression.
(a) Expression of Orf8WT and Orf8ΔARKSAP from FAC sorted cells used for RNA-seq. (b) Volcano plot of differential gene expression analysis of Orf8WT expressing cells compared to GFP expressing cells. (c) Volcano plot of differential gene expression analysis of Orf8ΔARKSAP expressing cells compared to GFP expressing cells. Red indicates significantly differentially expressed genes. (d) Overlap of genes down or upregulated by Orf8 and Orf8ΔARKSAP compared to GFP expressing cells. (e) Gene ontology analysis of genes that are downregulated by Orf8 compared to Orf8ΔARKSAP. (f-g) Volcano plot of differential gene expression analysis of Orf8WT expressing cells compared to Orf8ΔARKSAP expressing cells graphed by p value (f) and mean expression (g). (h) Gene tracks of genes that are induced by Orf8ΔARKSAP but show a dampened response to Orf8. (i) Gene tracks of a gene that is not disrupted by Orf8 expression. (j) H3K9ac CUT&Tag reads at down and upregulated DEGs in Orf8 verses Orf8ΔARKSAP. (k) ATAC-seq reads at down and upregulated DEGs in Orf8 verses Orf8ΔARKSAP. DEG: differentially expressed gene. Volcano plots show differentially expressed genes in DESeq2 analysis with multiple comparison corrections. Gene ontology significance based on clusterProfiler analysis with Benjamini-Hochberg adjusted p-values. For RNA-seq, N = 2 for GFP and Orf8ΔARKSAP and N = 3 for Orf8WT. FACS gating strategy and cell numbers isolated shown in Supplemental Fig. 2.

