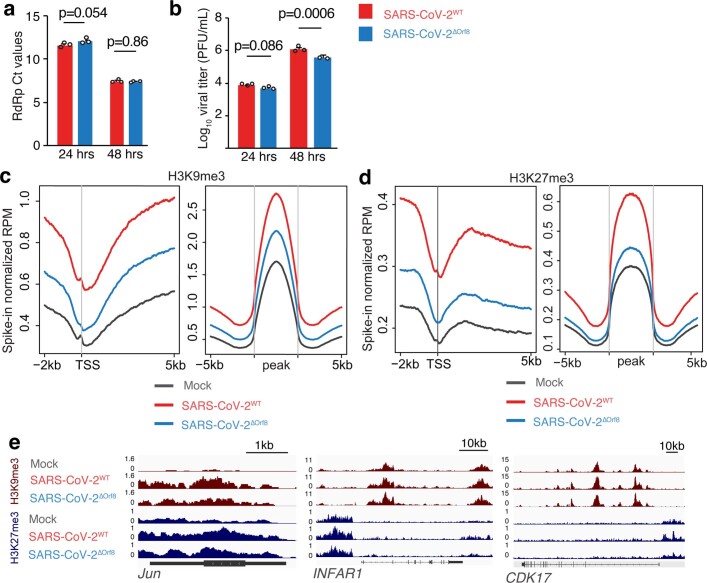
Extended Data Fig. 7. Orf8 mediates SARS-CoV-2 effects on repressive histone PTMs.
(a) qRT-PCR analysis of expression of SARS-CoV-2 gene RdRp analysis of viral titer in A549ACE pulmonary cells at 24 and 48 h after infection with SARS-CoV-2WT or SARS-CoV-2ΔOrf8 at MOI = 1. (b) Plaque assay analysis of viral titer in A549ACE pulmonary cells at 24 and 48 h after infection with SARS-CoV-2WT or SARS-CoV-2ΔOrf8 at MOI = 1. N = 3 replicates from infection done in parallel. (c-d) ChIP-RX for H3K9me3 (c) and H3K27me3 (d) of A549ACE cells with SARS-CoV-2WT, SARS-CoV-2ΔOrf8, or mock infection at MOI = 1, 48 h after infection. N = 3. Peaks shown in right panels of c-d indicate SICER peak regions from merged ChIP-RX data. Grey lines indicate peak borders and within-peak distances anchored by each end of the peak. (e) ChIP-seq gene tracks of genes in signaling pathways relevant to viral response. P values indicate 2-way ANOVA with Šidák’s multiple comparisons correction. Bar plots indicate mean ± SEM. RPM, reads per million mapped reads.

