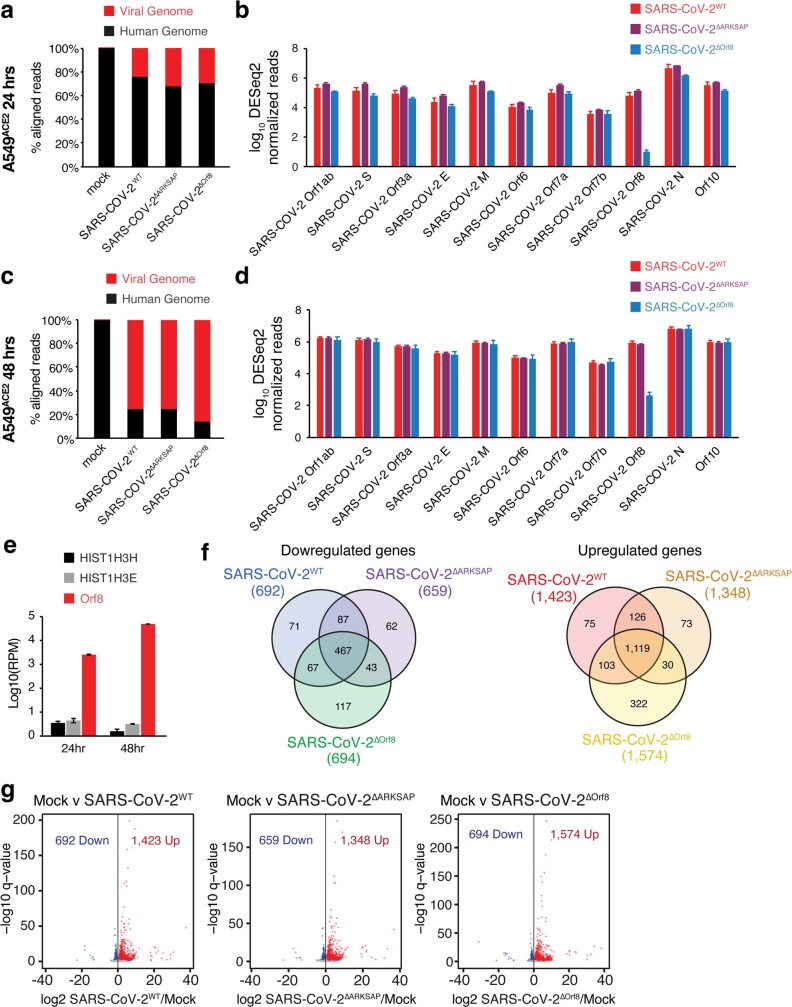
Extended Data Fig. 9. RNA-sequencing read comparisons and 48 hour DEG.
(a) Reads aligned to the human and SARS-CoV-2 genomes 24 h after infection. (b) Levels of SARS-CoV-2 transcripts in cells infected with SARS-CoV-2WT, SARS-CoV-2ΔARKSAP, or SARS-CoV-2ΔOrf8 24 h after infection. (c) Reads aligned to the human and SARS-CoV-2 genomes 48 h after infection. (d) Levels of SARS-CoV-2 transcripts in cells infected with SARS-CoV-2WT, SARS-CoV-2ΔOrf8, or SARS-CoV-2ΔARKSAP 48 h after infection. (e) Normalized reads of SARS-CoV-2 Orf8 and human transcripts of histone H3 genes in cells infected with SARS-CoV-2WT or SARS-CoV-2ΔOrf8. (f) Overlap of differentially expressed genes in response to SARS-CoV-2WT, SARS-CoV-2ΔOrf8, or SARS-CoV-2ΔARKSAP compared to mock infection at MOI = 1, 48 h after infection. (g) Differential gene expression analysis by RNA-seq of A549ACE cells 48 h after SARS-CoV-2WT, SARS-CoV-2ΔOrf8, or SARS-CoV-2ΔARKSAP, compared to mock infection at MOI = 1. Significantly differentially expressed genes (relative to mock infection) are shown in blue (down) and red (up). N = 3. Volcano plots show differentially expressed genes in DESeq2 analysis with multiple comparison corrections. Bar plots indicate mean ± SEM.

