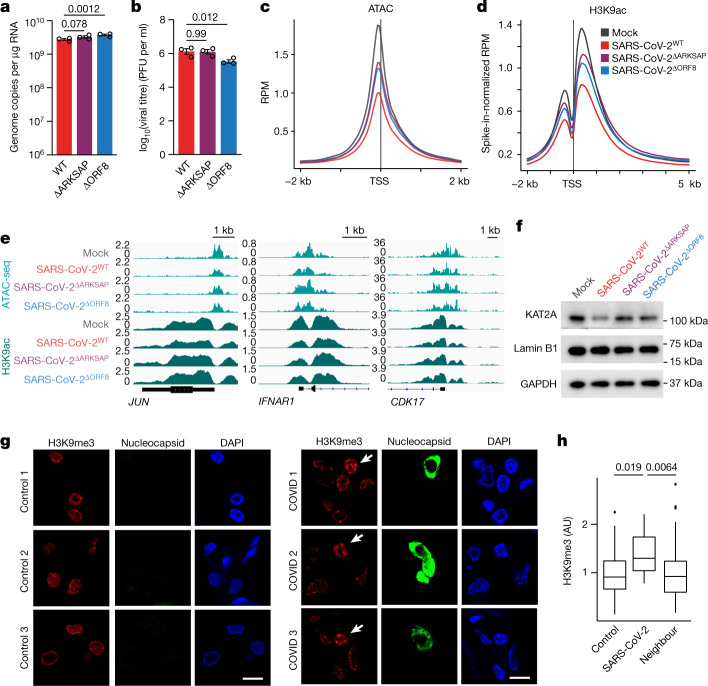
Fig. 3. SARS-CoV-2 infection affects histone PTMs.
a,b, Reverse transcription with quantitative PCR (qRT–PCR) analysis of expression of the SARS-CoV-2 gene RDRP (a) and plaque assay analysis of viral titre (b) in A549ACE cells 48 h after infection with wild-type SARS-CoV-2 (SARS-CoV-2WT), SARS-CoV-2ΔARKSAP or SARS-CoV-2ΔORF8 at MOI = 1. Two-way ANOVA with Dunnett’s multiple-comparison test (additional time points shown in Supplementary Table 4). Representative of two independent infections. PFU, plaque-forming units. c,d, ATAC-seq (c) and H3K9ac ChIP-RX (d) of A549ACE cells with SARS-CoV-2WT, SARS-CoV-2ΔARKSAP, SARS-CoV-2ΔORF8 or mock infection 48 h after infection. MOI = 1. n = 3 for ATAC-seq except n = 2 for SARS-CoV-2ΔARKSAP. n = 3 for ChIP-RX except n = 2 for SARS-CoV-2WT. RPM, reads per million. e, ChIP–seq and ATAC-seq gene tracks of genes in signalling pathways relevant to viral response. f, Western blot analysis of KAT2A in A549ACE cells following infection with wild-type or mutant SARS-CoV-2 viruses. g, Post-mortem lung tissue from patients with COVID-19 stained for H3K9me3 and nucleocapsid protein to identify SARS-CoV-2-infected cells. Arrows indicate infected cells. h, Quantification of H3K9me3 in infected cells compared with neighbouring cells and with control tissue. n = 12 infected cells and 131 uninfected neighbouring cells from three patients with COVID-19 and 60 cells from three control individuals. One-way ANOVA with post hoc two-sided t test and Bonferroni correction. Scale bars, 10 μm. For gel source data, see Supplementary Fig. 1o. Box plots are centred on the median with bounds at the 25th and 75th percentiles, the minimum and maximum defined as the median ± 1.5× the interquartile range and whiskers extending to the lowest and highest values in the range.

