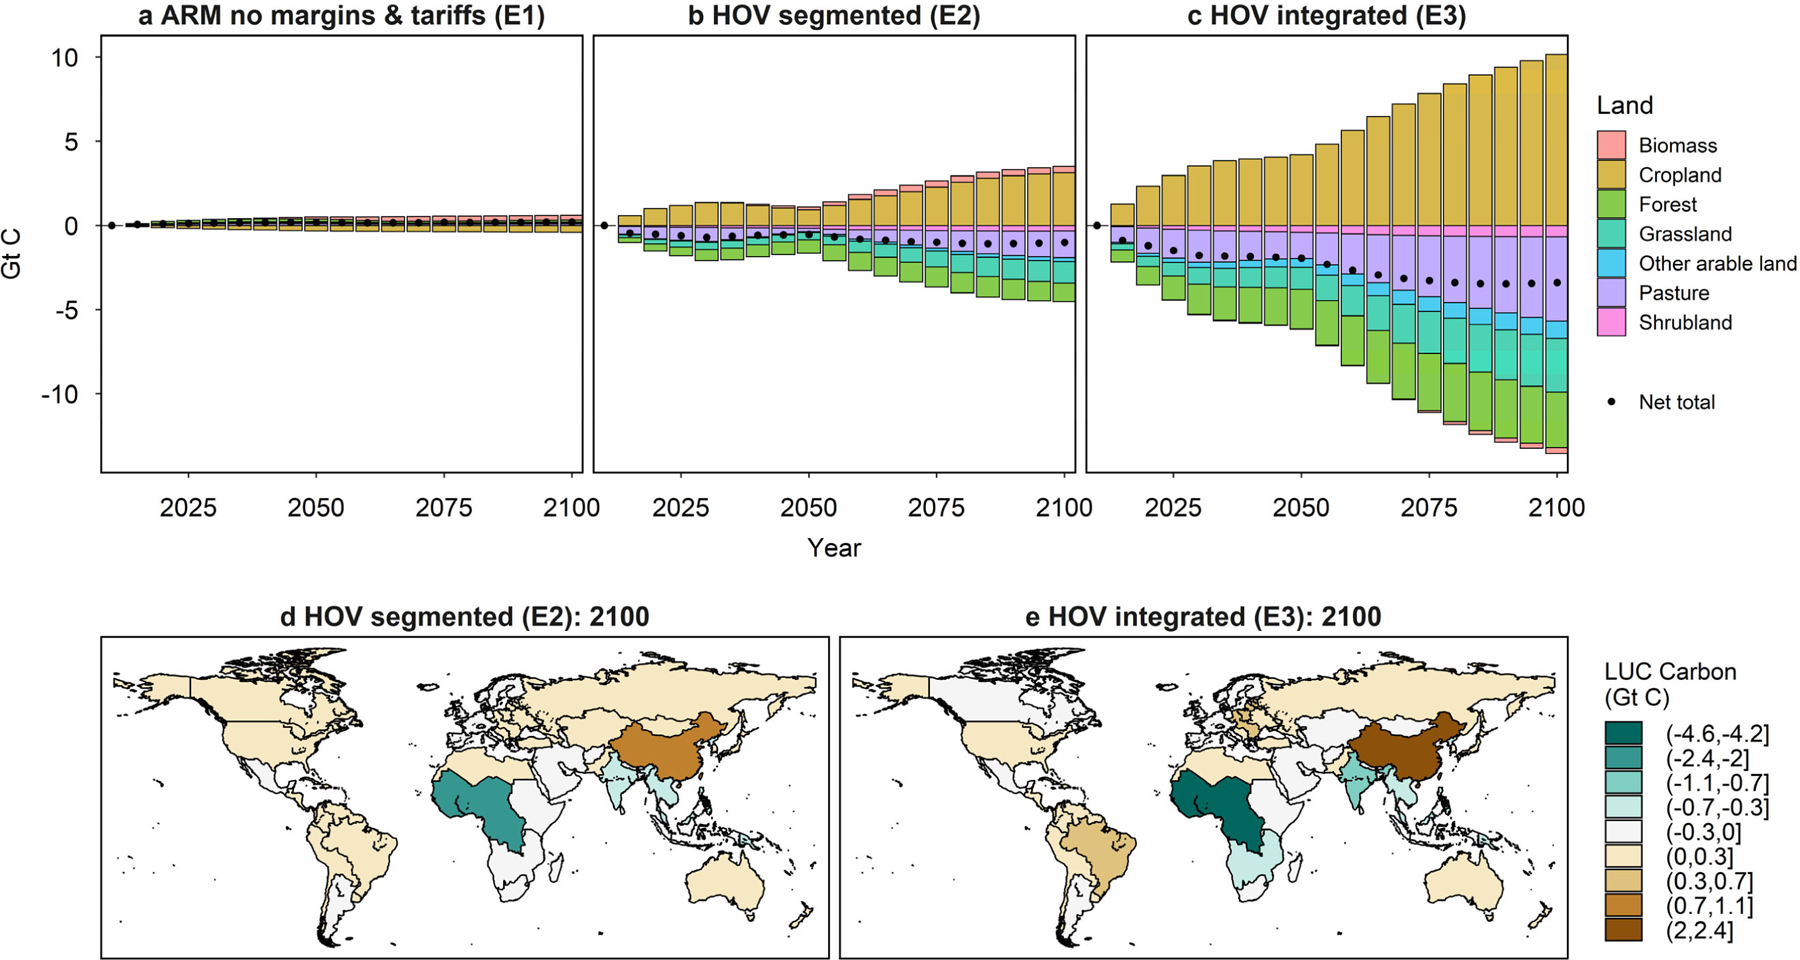
Fig. 10. Comparison of land use change emissions across alternative scenarios relative to the reference scenario (E0).

See scenario descreptions in Fig. 9 caption. Points represent the net total of land use change emissions from all lands (a - c). The total land use change emissions by 2100 are presented at GCAM regional level for the two HOV scenarios (d – e). See Fig. S27 for water basin level results of Fig. 10 d – e and Table S8 for regional summary statistics.
