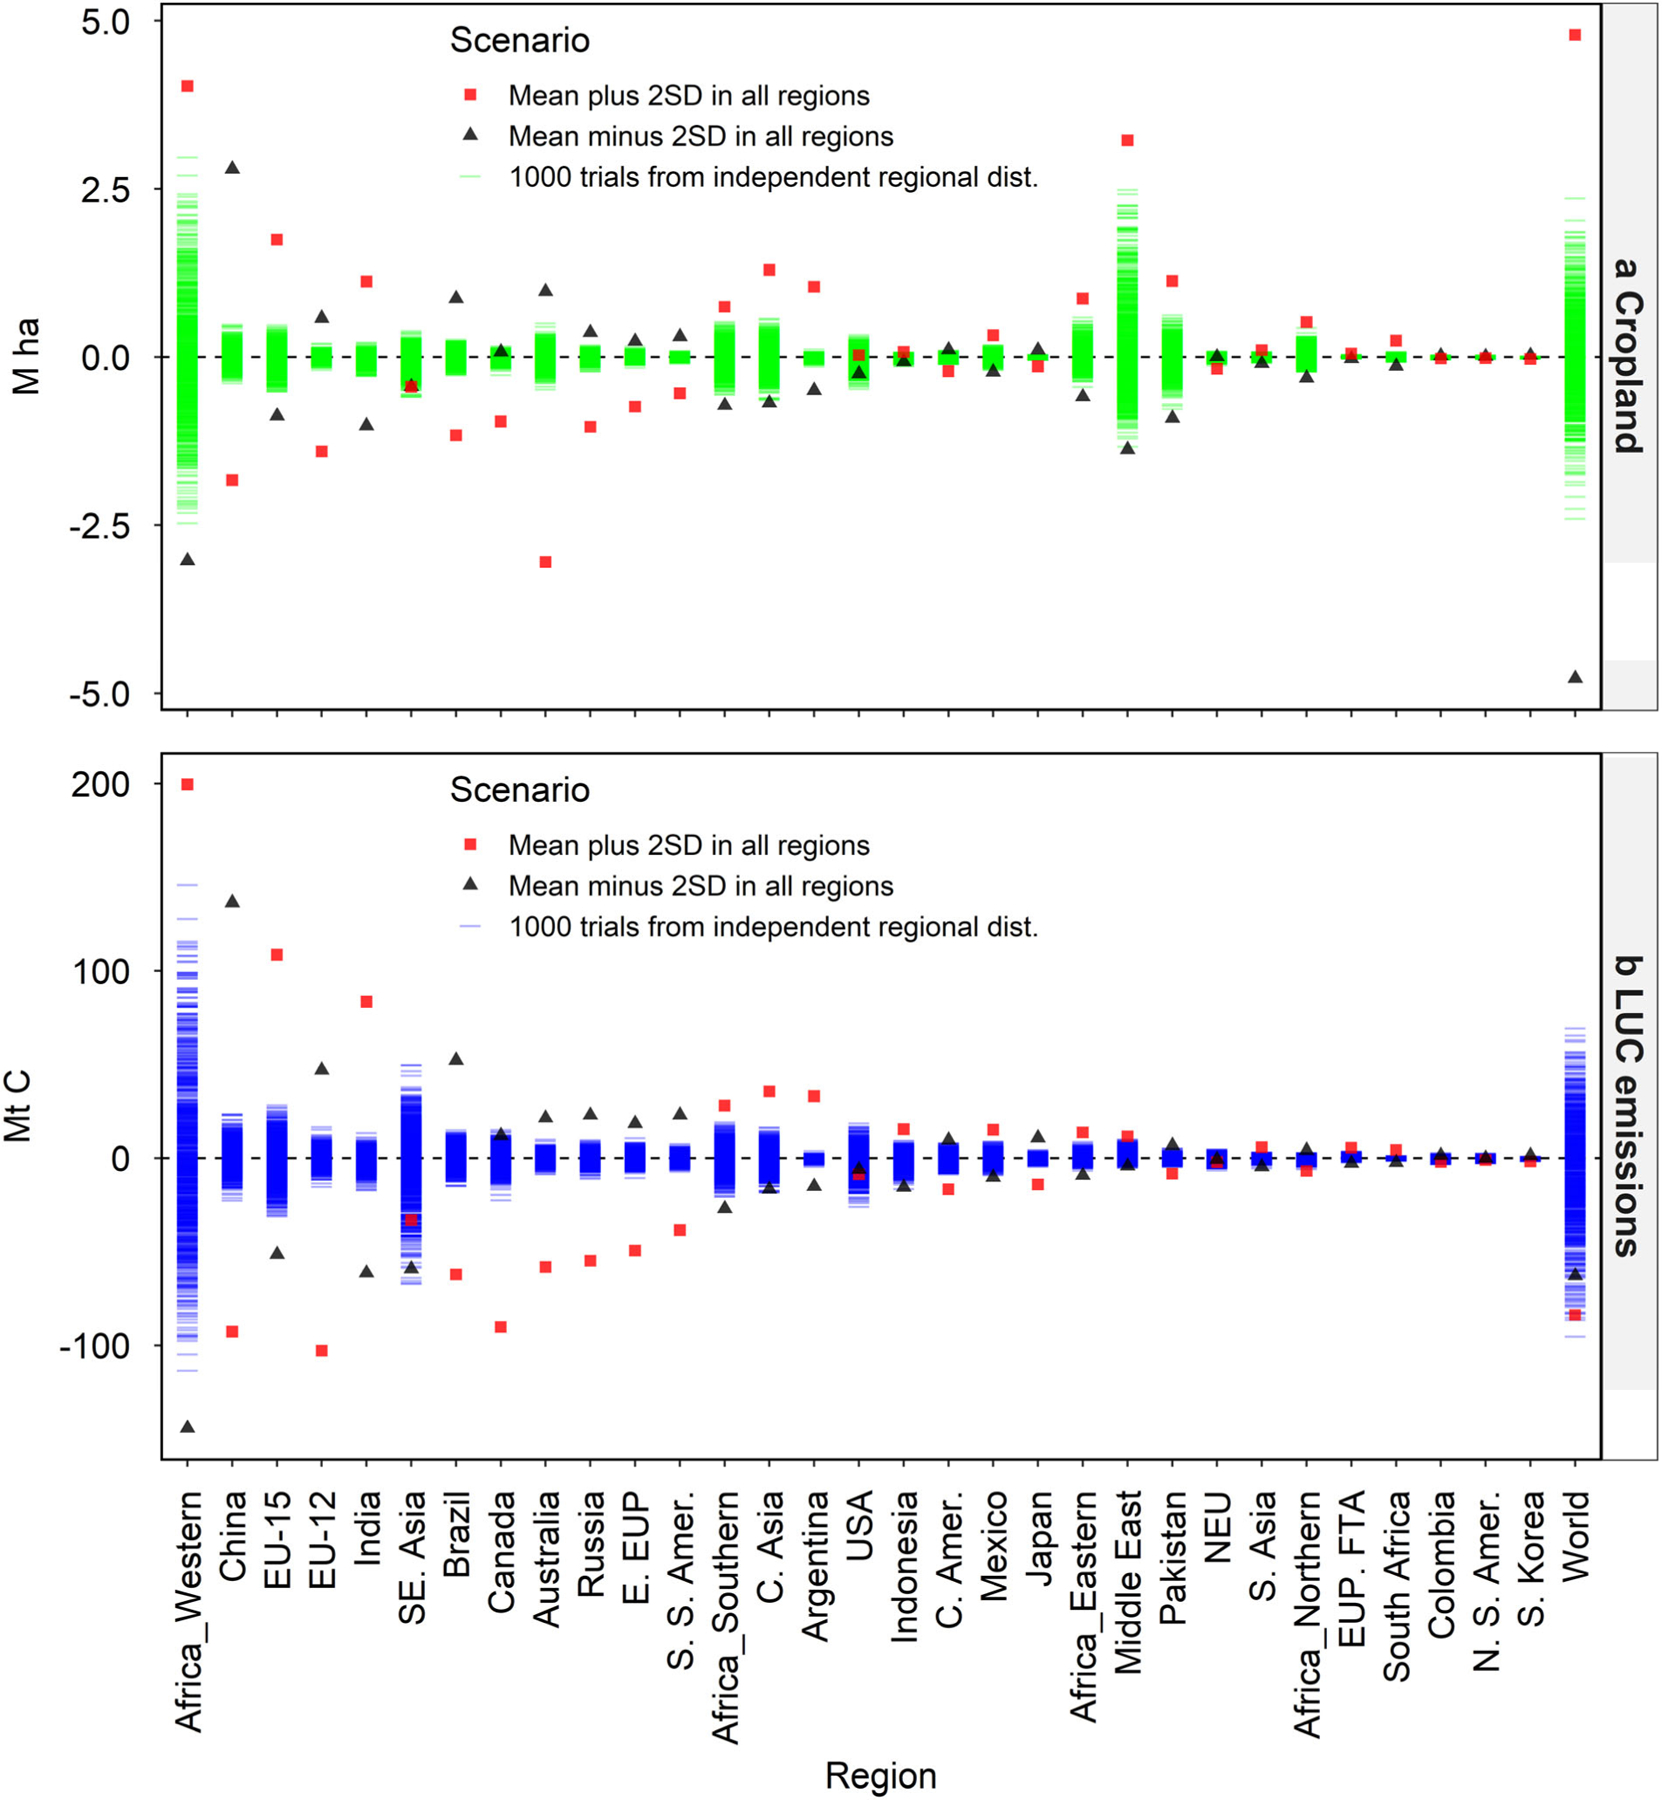
Fig. 11. Sensitivity of regional cropland change and LUC emissions by 2100 to trade parameters.

Cropland change (a) and LUC emissions (b) results are presented as the deviation relative to the deterministic reference results (E0). Regions are ranked by the sensitivity range of the LUC emissions. Dashes represent the distribution of results from one thousand sets of trade parameters randomly drawn from independent regional distributions. The red square and black triangle represent results from extreme scenarios of using uniform regional trade parameters of mean plus and minus two times of the standard deviation. See summary statistics in Table S9.
