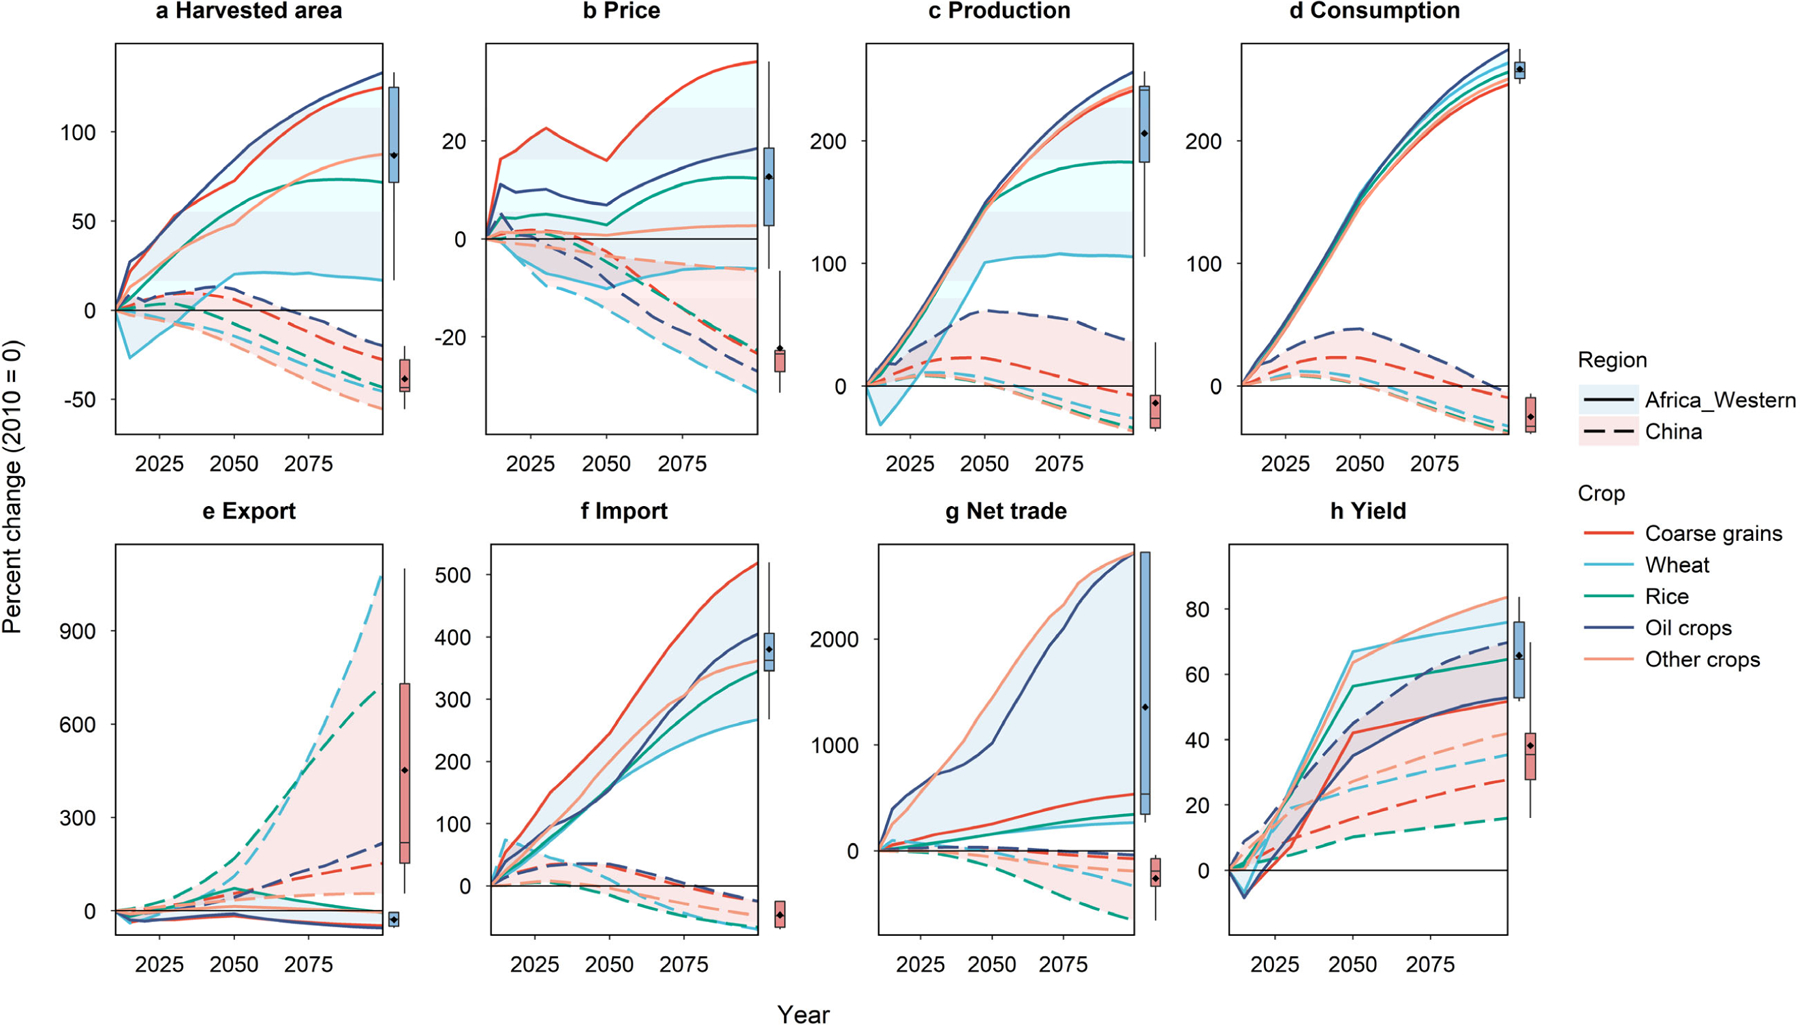
Fig. 5. Projections of regional agricultural economics to 2100 relative to 2010 for China and Western Africa in the reference scenario (E0).

Results are presented as percent change relative to 2010 for variables including agricultural crop harvested area (a), producer price (b), production (c), consumption (d), export (e), import (f), net trade (g), and yield (h) for China (dotted curves) and Western Africa (Solid curves) by crops (distinguished by color). Shadows denote full ranges of results across crops (i.e., coarse grains, wheat, rice, oil crops, and other crops) in a region. The boxplots to the right of each plot present the mean values (points), the median values (lines), the first and third quartiles (boxes), and the full ranges (whiskers) across crops in a region in 2100.
