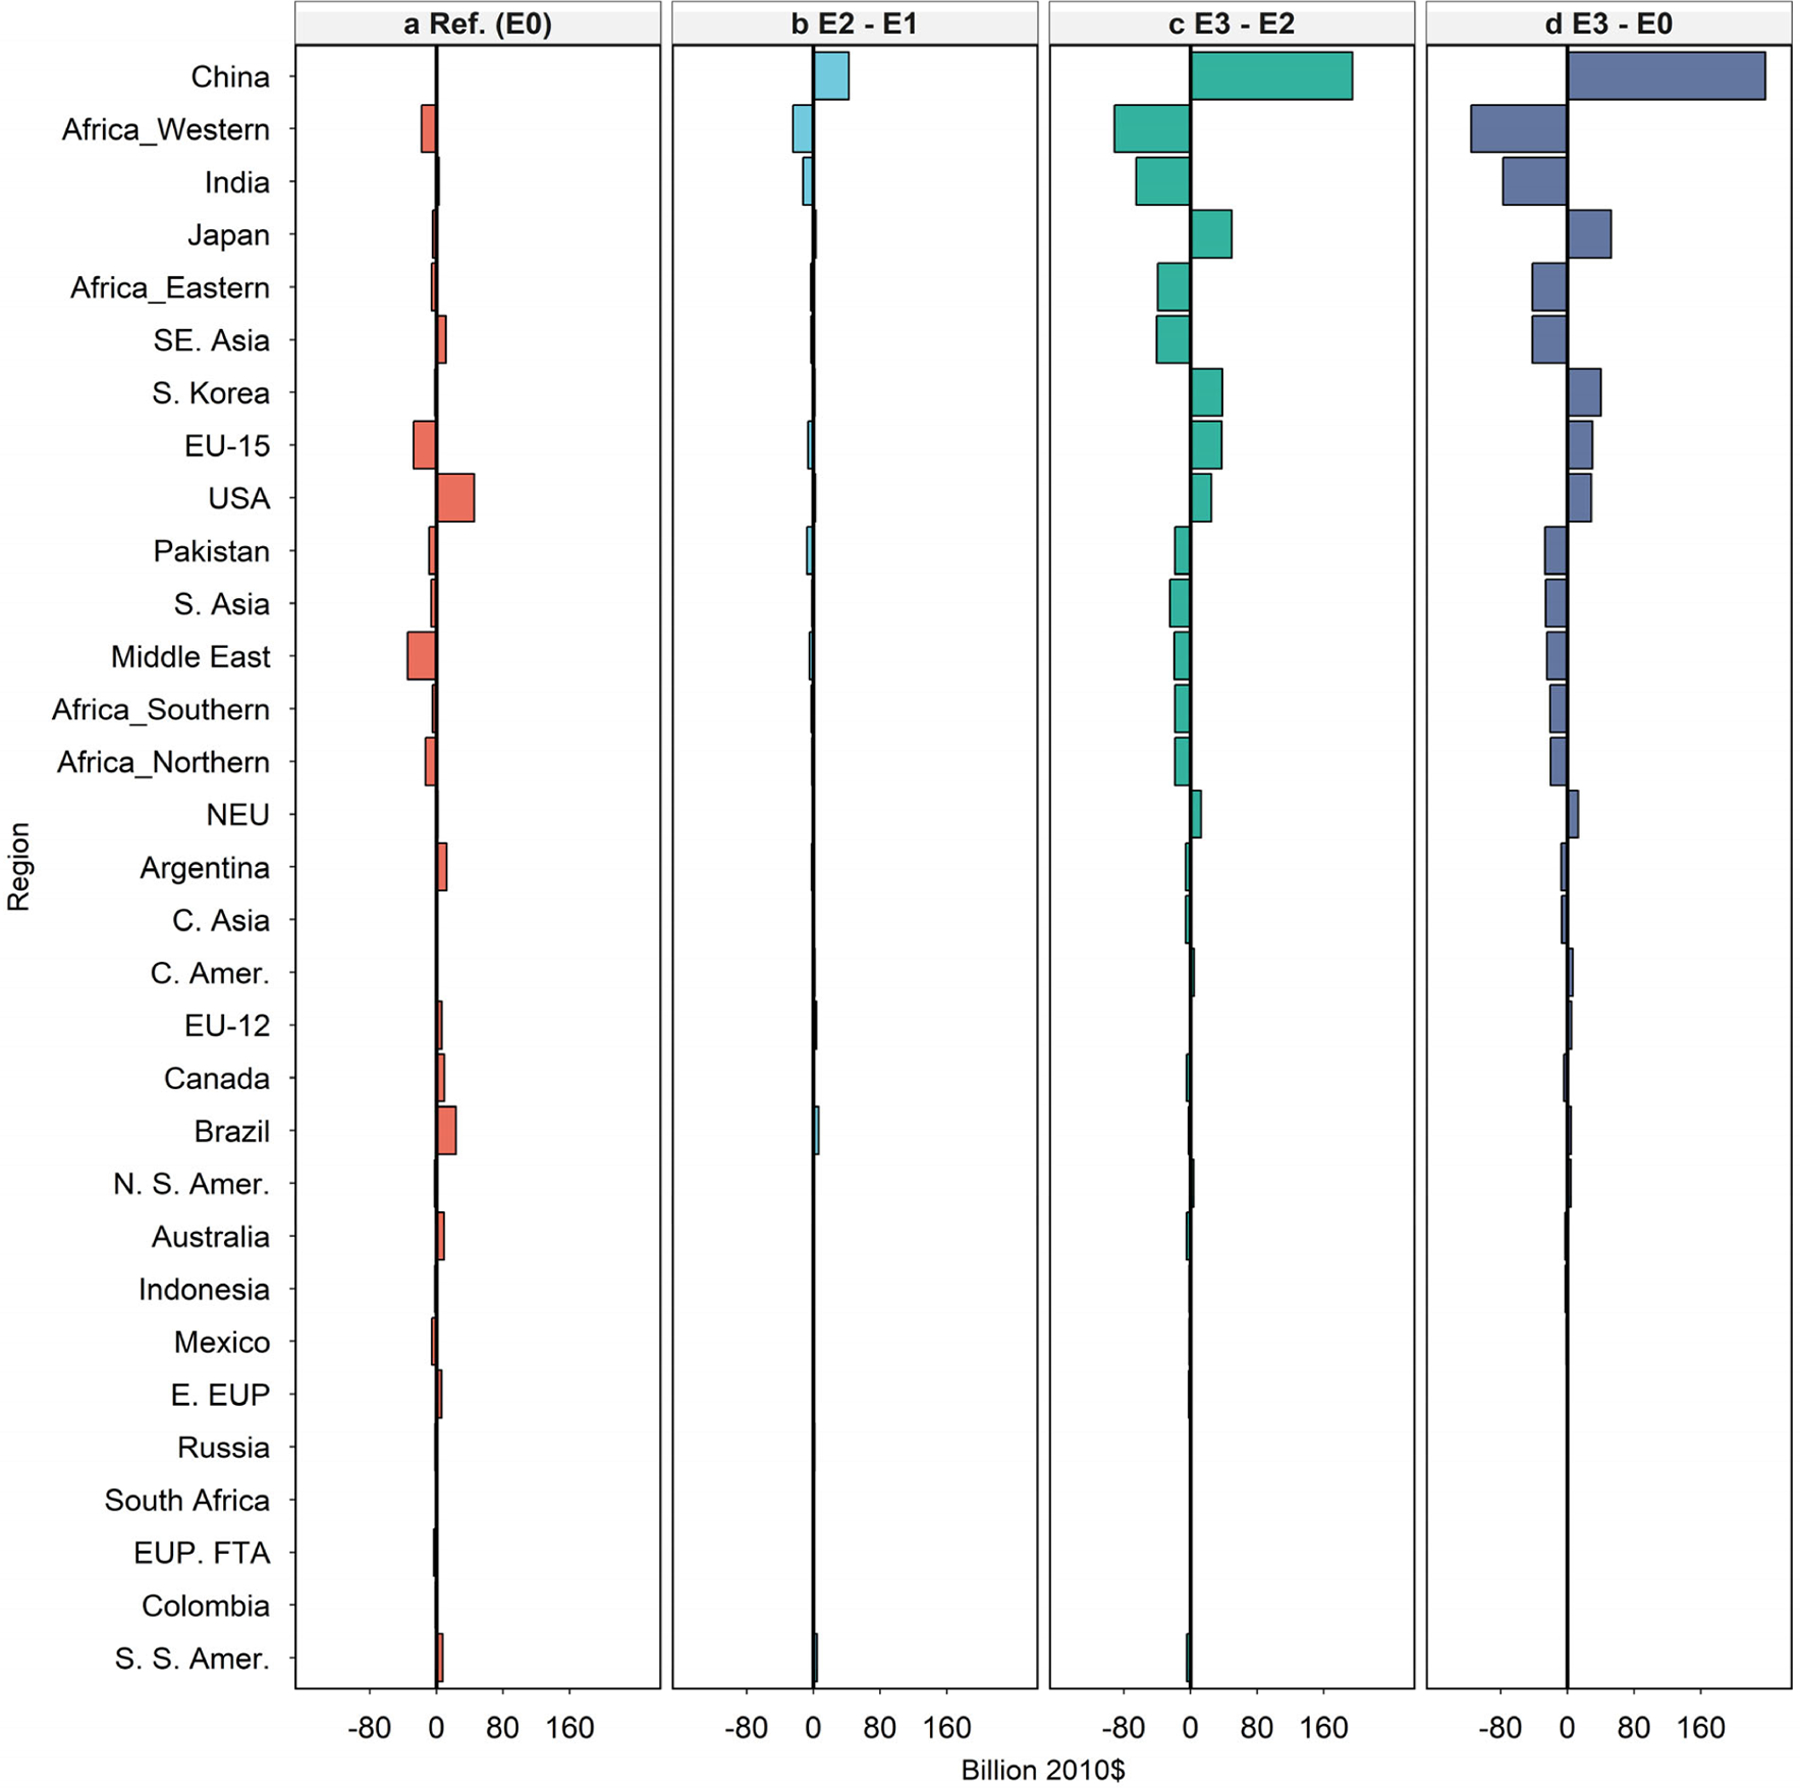
Fig. 7. Step-by-step decompostition of the full global market integration impact on net agricultural crop trade value flows projections in 2100.

Net crop trade value flows measured in producer prices in 2010 billion dollars are shown for 2100 for the reference projection (a), impacts from homogeneous product modeling in HOV (b), impacts from neglecting economic geography in IWM (c), and impacts from assuming full global market integration. Positive bars represent net exporting and negative bars represent net importing. Note that regional impacts from removing margins and tariffs (E1 – E0) were negligible and are not presented. See Table S7 for detailed regional and world level data and SI Section S3.2 for additional discussions.
