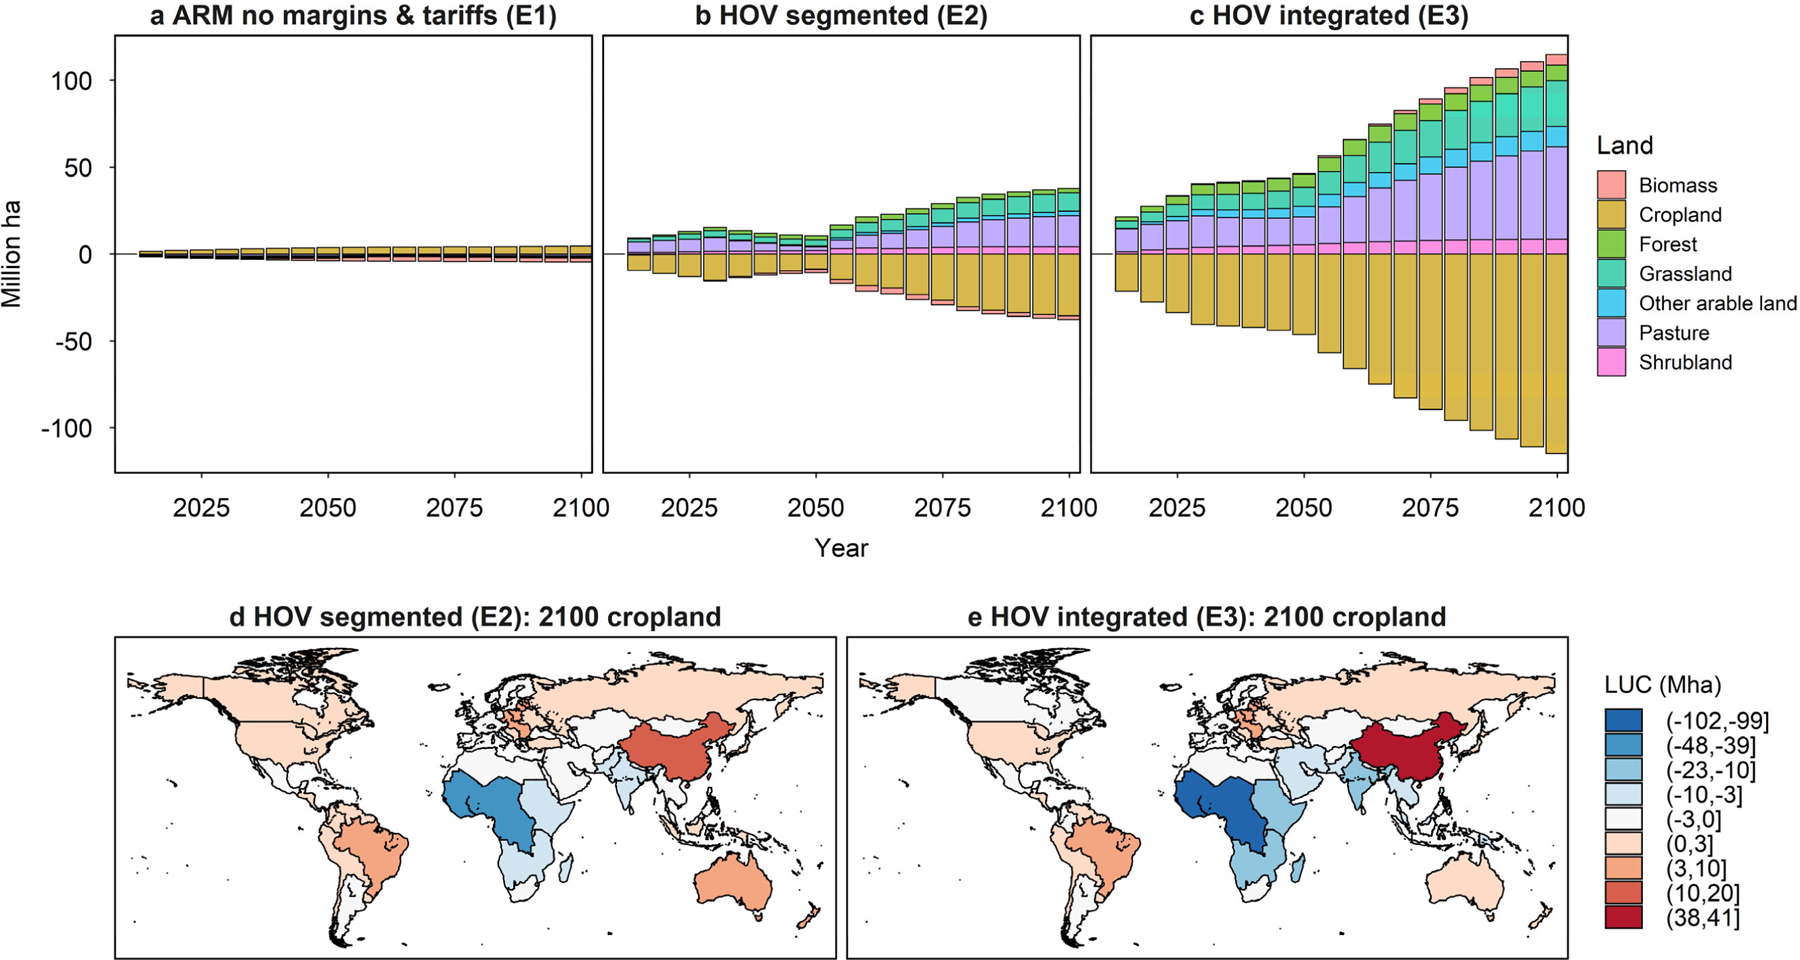
Fig. 9. Comparison of land use change across alternative scenarios relative to the reference scenario (E0).

Results shown are the land use difference between alternative scenarios and the reference scenario (Armington with margins and tariffs). Global results projected to 2100 by land type (colored bars) are presented for alternative scenarios, including Armington without margins and tariffs (a), HOV with segmented global markets structure (b), and HOV with integrated global market structure (c). The cropland use change results for cropland by 2100 are also presented at GCAM regional level for the two HOV scenarios (d – e). See Fig. S25 for results of harvested area changes and Fig. S26 for water basin level results of Fig. 9 d – e.
