
Figure 5. Fetalization is a driver of regulatory change in heart disease.
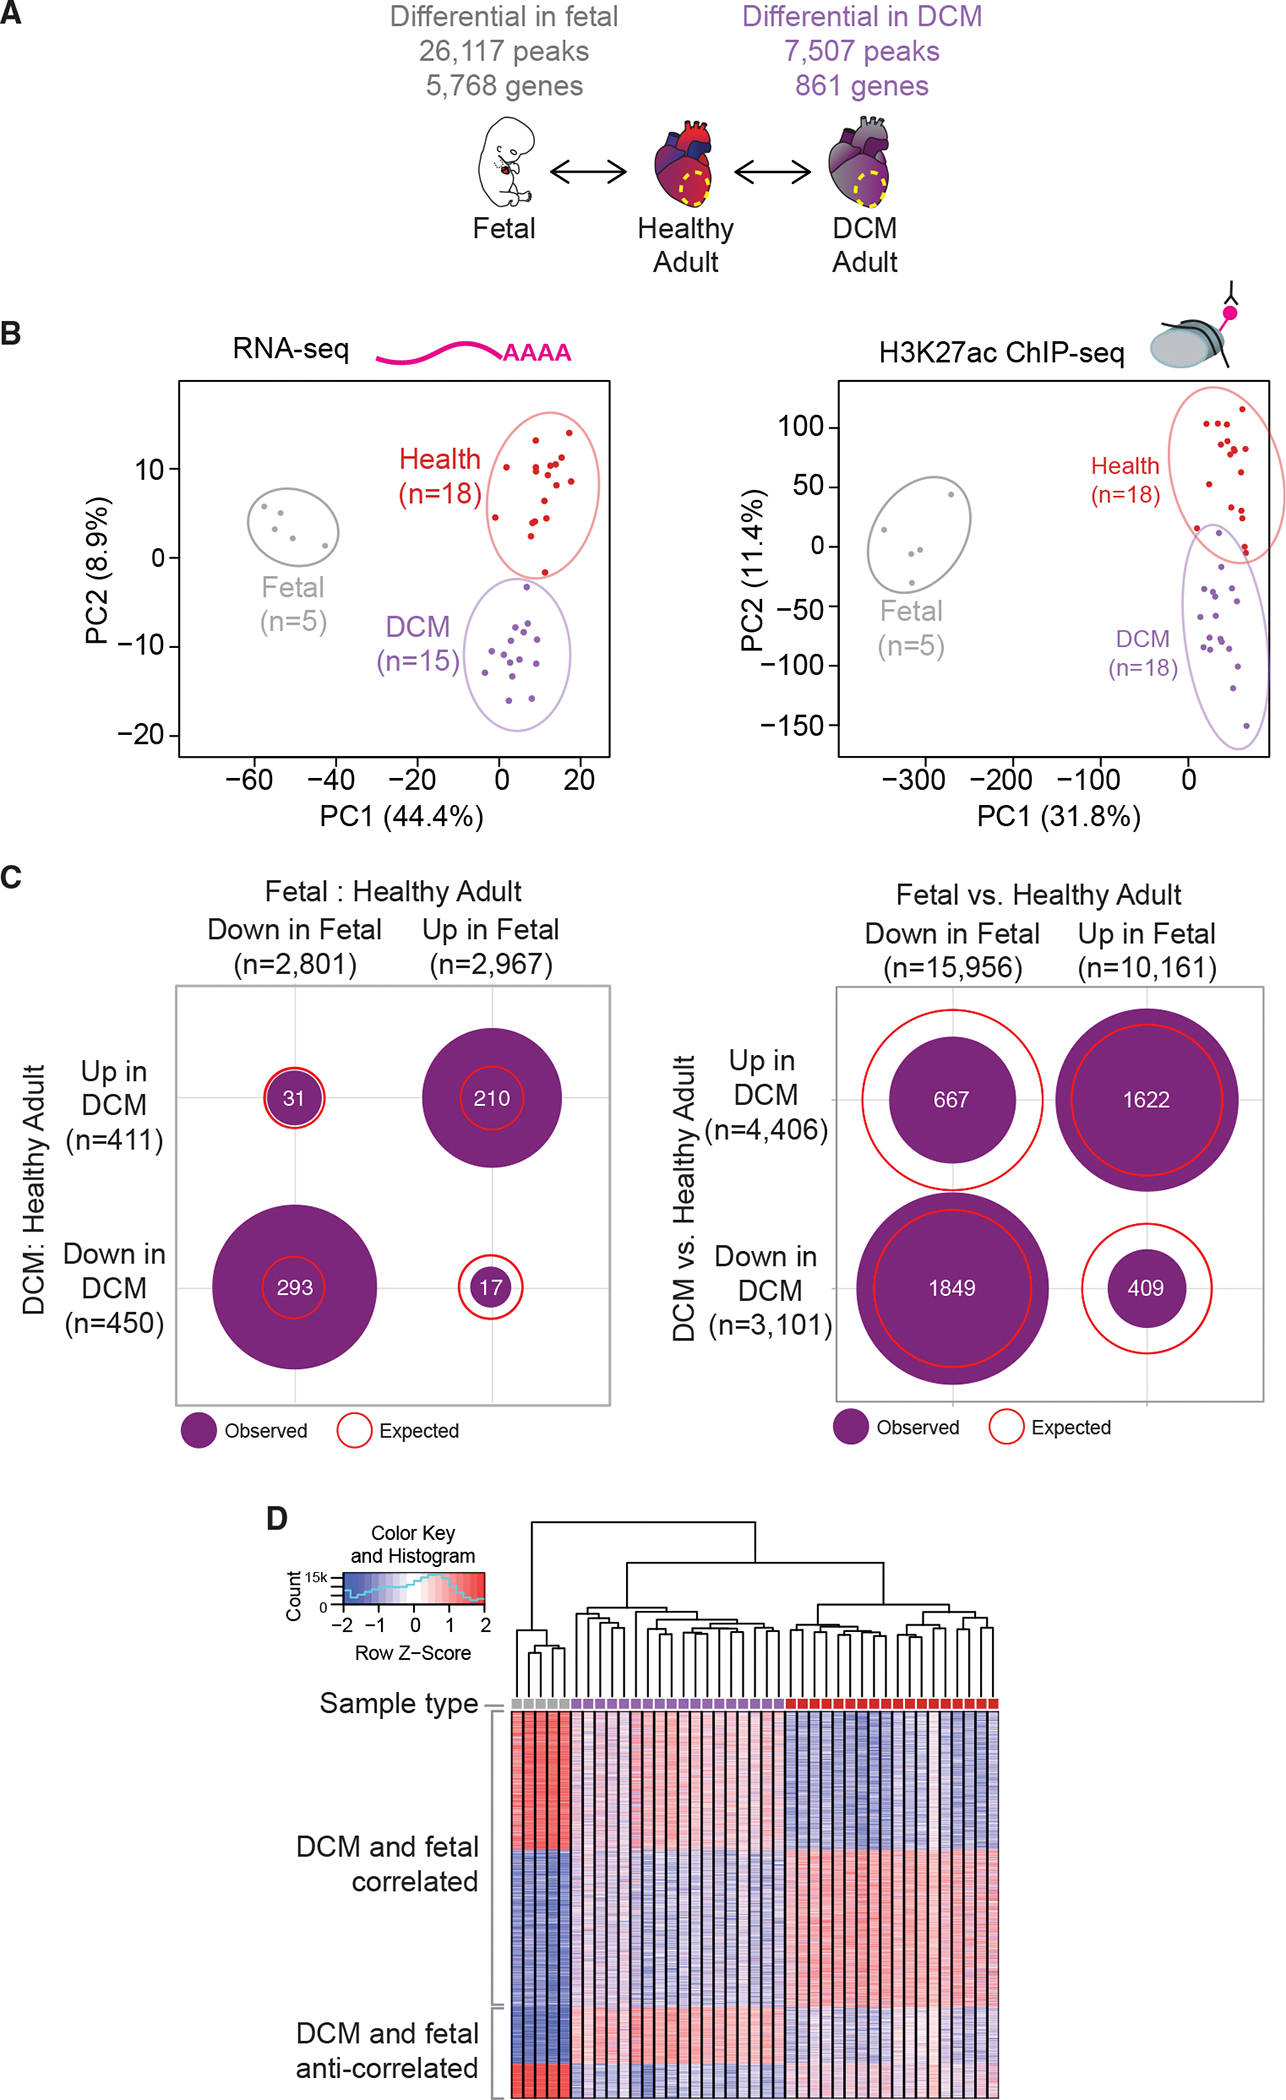
(A) Schematic of experimental comparisons and number of differential genes/peaks.
(B) Principal-component analysis showing the first two principal components (PC1 and PC2) for the top 1,000 variably expressed genes from RNA-seq (left) and for distal enhancer peaks from ChIP-seq (right). Prenatal samples are gray, DCM samples are purple, and healthy samples are red.
(C) Number of enhancer peaks co-regulated in prenatal and DCM states for RNA-seq (left) and ChIP-seq (right). Purple circles show number of peaks overlapping in each quadrant. Red lines show expected overlap between each category.
(D) Heat map showing all differential peaks between 41 samples: 5 prenatal (gray), 18 DCM (purple), and 18 healthy (red).