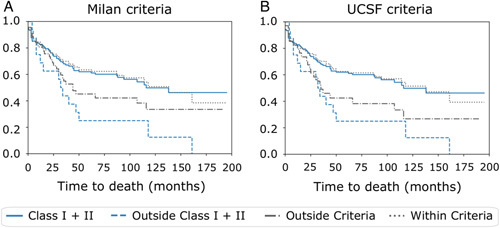
FIGURE 3.

Overall survival curves of transplanted liver cancer patients at ~15 years according to the original Milan or UCSF selection criteria (left and right columns, respectively). Cumulative overall survival curves for the entire population of transplanted patients divided according to (A) Milan or (B) UCSF criteria. The curves represent the overall survival prediction according to HepatoPredict Class I+II (blue lines) versus Milan or UCSF Criteria (gray lines).
